A historical evaluation of the Chainlink integration vs an alternative Curve pool EMA Oracle, and implications for the Prisma protocol.
#Introduction
This study stems from the challenge of obtaining reliable on-chain price feeds that are both maximally secure and reflective of the current spot price for the target asset. In particular, we focus our attention on Prisma Finance’s collateral assets (wstETH, rETH, cbETH, and sfrxETH) and on Ethereum-based Liquid Staking Derivatives (LSDs) generally. Some of these assets lack Chainlink data feeds, commonly considered the gold standard for reliable price data, impacting their integration with the Prisma platform.
The latest Curve Finance stable pool implementations include an internal pool Oracle that computes an Exponential Moving Average (EMA) to derive manipulation-resistant price data. The Oracle is primarily used for securing collateral in Curve’s own crvUSD markets, although integrators are beginning to explore using the Oracle in other DeFi applications.
The main goal of this report is to determine if Curve Finance’s Oracle can be a reliable alternative to Chainlink for ETH LSD tokens. This study involves statistical analysis on the effectiveness of Curve’s price Oracle, comparing its volatility, accuracy, and overall performance relative to a Uniswap reference spot price, which is assumed to be the accurate price on-chain.
The analysis is broken up into two related studies: - stETH Oracles Residuals Analysis: A Chainlink v. Curve comparative study using historical data to determine the mean and standard deviation of Oracle deviations against a reference spot price. - stETH MEV on Redemptions Analysis: A Chainlink v. on-chain Oracle comparative study using historical data that examines redemption events on Prisma and estimates bot profitability and expected behavior using the alternative Oracle.
Following the analysis, we provide a preliminary spec for an Oracle that, based on findings from the analysis, would be expected to improve Oracle price deviations with attention to maintaining reliability of the Oracle. The proposed solution may serve as an initial blueprint for additional research into optimizing the Oracle.
#Section 1: Relevant Background
#1.1 Oracle Functions in Prisma Protocol
The Oracle effectiveness is assessed in the specific context where the Oracles are employed by Prisma: liquidations and redemptions. (Note also that the same Oracles are also used to perform sales of tokens earned to the protocol fee receiver and from the “tokenized stability pool”, which will have increasing importance once launched.)
The Oracle performance has important repercussions for Prisma users because there may be opportunities for arbitrageurs to profit from the deviation between the Oracle price and the spot price. It is in the best interest of the Prisma protocol and its vault depositors to ensure that the most accurate price feed available is used when processing liquidations and redemptions, without otherwise sacrificing security of the pricing source.
An overview of the two Oracle functions in Prisma are described below:
#1.1.1 Liquidations
To protect Prisma from accruing bad debt, that is, a debt position that exceeds the value of its collateral, the LiquidationManager contract executes the liquidation logic across all active TroveManagers (Prisma vaults). Liquidation can trigger in one of three ways, depending on the collateral ratio of the target account and the system-wide collateral ratio.
-
Individual Collateral Ratio (ICR) <= 100%: The account (trove) is undercollateralized. The entire debt and collateral is redistributed between remaining active troves, effectively socializing losses.
-
100% < ICR < Minimum Collateral Ratio (MCR): The trove is below the liquidation threshold, but can safely be liquidated. A Stability Pool is used as a reserve for processing liquidations (i.e. an incentivized liquidation pool). The collateral is distributed amongst stability pool depositors. If the Stability Pool’s balance is insufficient to completely repay the trove, the remaining debt and collateral is redistributed between the remaining active troves.
-
MCR <= ICR < Global Total Collateral Ratio (GTCR) && GTCR < 150%: The system is in Recovery Mode, meaning a trove becomes liquidatable when its CR drops below the GTCR instead of the MCR. The trove is liquidated first by using Stability Pool deposits. Collateral equal to MCR of the value of the debt is distributed between Stability Pool depositors. The remaining collateral is left claimable by the trove owner.
The likelihood of liquidations on Prisma should increase during volatile market conditions when ETH or ETH LSDs experience large price swings, especially to the downside. While Oracle failure or manipulation can affect the protocol at any time, there may be increased risk of Oracle malfunction at times when it is most essential. Collateral assets may be mispriced due a spike in gas fees that prevents timely price updates, or the Oracle’s pricing methodology does not sufficiently track the heightened volatility. There is the possibility that bad debt accrues and must be distributed across active troves, or that borrowers become unfairly liquidated (in cases where the Oracle incorrectly reports a price lower than the fair market price).
#1.1.2 Redemptions
Redemptions are always available to arbitrageurs who may choose to redeem 1 mkUSD for $1 worth of collateral (+ a dynamic redemption fee), starting with the trove with the lowest collateral ratio in the system. This serves to strengthen the mkUSD peg when its price drops below $1. The redemption process reduces the target trove’s collateral exposure and increases its collateral ratio. The party performing the redemption pays a fee called the redemption fee. The redemption fee is scoped to each TroveManager and is the sum of the redemption fee floor + baseRate. The baseRate variable stored in the TroveManager increases proportional to the fraction of the total mkUSD supply that was redeemed and deceases linearly over time. This dynamic fee regulates the rate at which redemptions can profitably occur.
While liquidations have historically been a rare occurrence on Prisma, redemptions are quite common, and worthy of special consideration concerning the Oracle. MEV bots are actively scanning for such opportunities for quick profits with flash loans.
Besides the inconvenience of having one’s trove forcibly redeemed against, the user may experience some value extraction due to the Oracle’s deviation from spot price. Mispricing can cause users to lose more assets than required, notably when the Oracle reports a price lower than the fair market value. On the other hand, an Oracle that reports a price above the fair market price may prevent redemptions from taking place, negating the redemption mechanism’s purpose to enforce a floor price on the mkUSD peg.
#1.2 Oracle Options
The main candidates for Oracle price feed services on Prisma are briefly described below.
#1.2.1 Chainlink (off-chain)
Chainlink is a decentralized Oracle network that aggregates from a broad set of market data sources and connects that data to smart contracts. Its structure relies on independent node operators to fetch and deliver data from a variety of exchange and market data aggregator APIs, thereby minimizing single points of failure and enhancing security. Data integrity is ensured through cryptographic methods and consensus mechanisms that validate data accuracy prior to transmission. Its methodology involves volume-weighted asset pricing (VWAP) to aggregate a fair market value that is most representative of an asset’s spot price.
The node network pushes prices on-chain at regular intervals (heartbeat) or by a price deviation threshold. This limitation, due to high gas fees on mainnet, can make price updates expensive, and may result in increased latency that reduces Oracle performance. Maintaining such Oracles can be expensive, especially during times of high volatility when timely Oracle updates are most essential.
#1.2.2 Curve Pool EMA Oracle (on-chain)
Recent Curve pool implementations, both StableSwap and CryptoSwap pools, include an EMA price calculation that is exposed publicly by the price_oracle() getter function. Instead of relying on external oracles, these pools internally calculate asset prices, relative to the token in the pool index 0, based on their own trading activity. The EMA smooths the pricing adjustments to increase the cost of manipulation, striking a balance between manipulation resistance and price deviation from spot. Each pool has an ma_exp_time that is configurable by a Curve DAO vote.
The EMA Oracle has been under active development, as disclosed in the Curve Oracle Docs:
If you are looking to use Curve’s “price oracle” functions, or any price Oracle, to provide on-chain pricing data in a decentralized application you are building, we recommend extreme caution. Source: Curve Resources
Different pool implementations have modified versions of the EMA Oracle code, making it essential that integrators understand the Oracle implementation for the target pool.
In November 2023, a bug was found in a deployed implementation of the stableswap-ng pools that affected the pool Oracle. The bug was found in a secondary audit by yAudit shortly after the pool implementation had been deployed. This prompted a proposal to upgrade the implementation and deprecate a handful of affected pools. No funds were at risk, but the event underscores the active development of the Curve pool Oracles that, while extensively audited, may have inconsistencies between pools and may continue to have bugs that make the Oracle vulnerable to manipulation or inaccuracy.
#1.3 Historical MEV on Redemptions
Section 3 of this report is an analysis of redemptions against the wstETH TroveManager. As redemptions have important implications for Prisma users, this sections introduces observations about historical redemptions that will be assessed in a comparative analysis against an alternative Curve EMA Oracle.
#1.3.1 BOT Behavior
A query of redemption events on the wstETH TroveManager reveals over 200 total redemption transactions, of which, 190 were identified as a BOT tx (the methodology used to identify if a tx is executed by a BOT is explained later in the same section). Following is a visualization that shows the frequency of these transactions over time.

Source: Dune query_3402461
There are only 3 BOTs that are frequently redeeming mkUSD:

Source: Dune query_3402461
Each BOT follows a similar general flow of obtaining mkUSD and redeeming it. Following is one of the BOT transactions, revealing some useful insights:
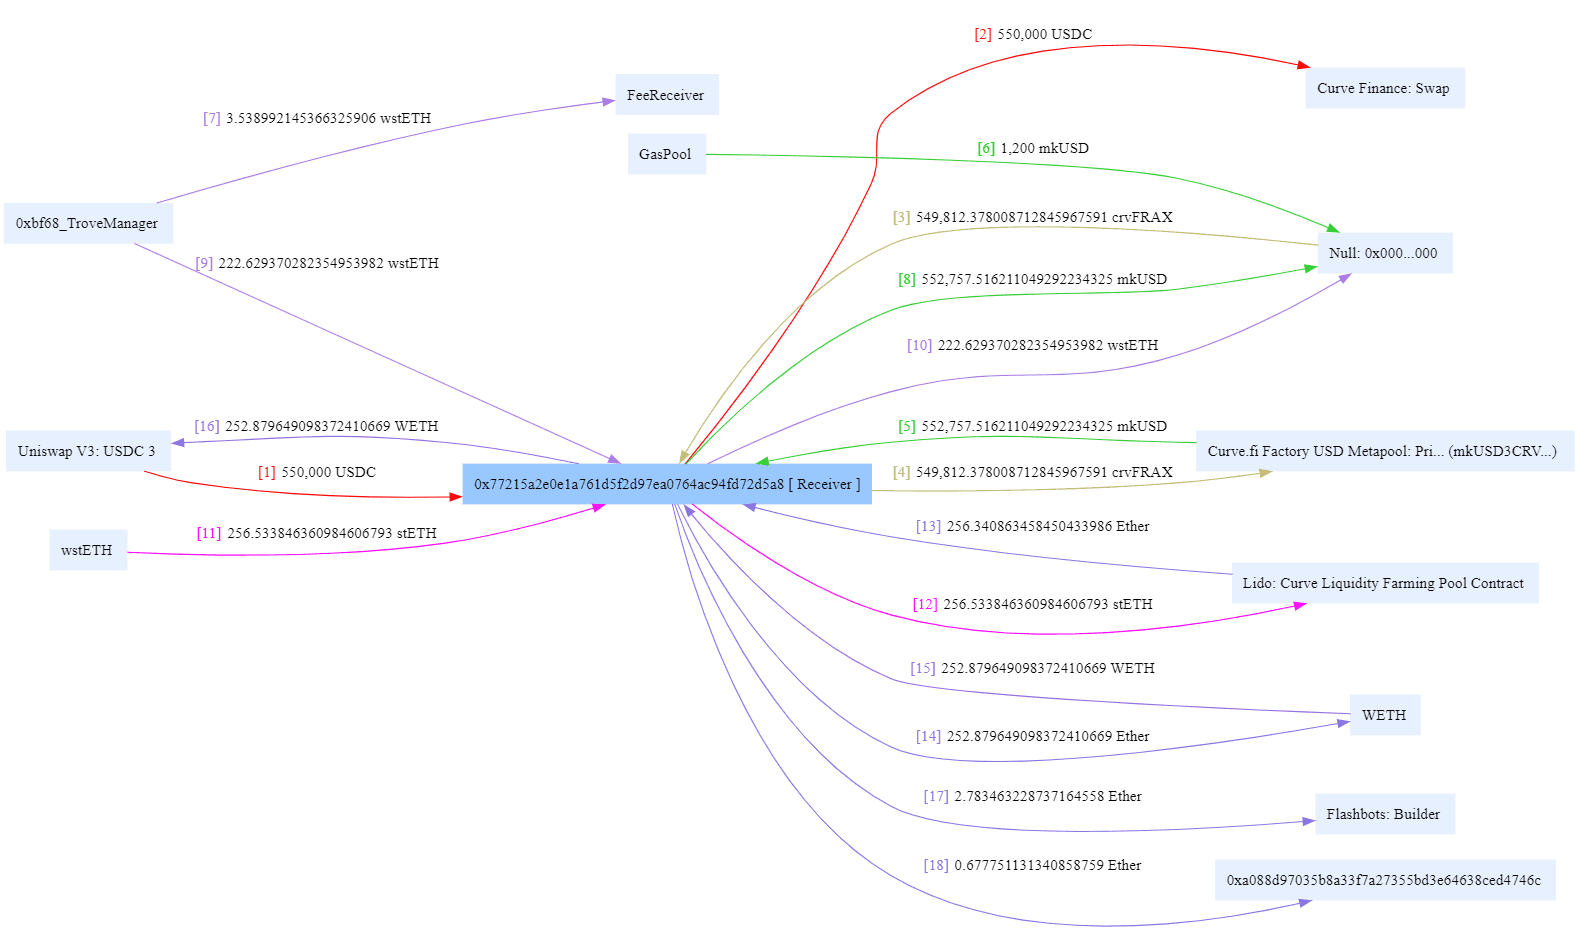
Source: Phalcon Tx Explorer
The BOT tx pattern can be be broken down as follows: 1. Get a flashloan from Uniswap V3: USDC 3 2. Convert the USDC to mkUSD using Curve.fi Factory USD Metapool: Prisma mkUSD. 3. Redeem mkUSD for wstETH on wstETH TroveManager. 4. Unwrap wstETH for stETH on wstETH. 5. Swap stETH for ETH on Curve stETH/ETH pool 6. Wrap the Ether, repay the loan, and distribute the profits and commissions.
The MEV profitability relies on the discrepancies of prices in steps 2,3, and 5. - 2: As the price of mkUSD decreases, redemption profitability increases. - 3: As the dynamic redemption fee decreases as a function of recent redemption quantity and time since redemption, redemption profitability increases - 5: As slippage on swapping the collateral asset (e.g. stETH) increases, redemption profitability decreases. LSDs such as stETH can be redeemed directly for underlying ETH, but this process involves a waiting period, making secondary market liquidity essential.
There is a mechanism employed by Prisma that limits the profit opportunity from the mkUSD to wstETH redemption with dynamic fees. Step 3 involves a dynamic fee to deter frequent and excessive redemptions. Despite this mechanism, there may still be redemptions made that extract MEV arising from Oracle mispricing. A mispricing quoted by the Oracle used for mkUSD redemption can cause a negative user experience by offering the trove owner a sub-optimal exchange rate for their collateral.
#1.3.2 Effectiveness of the wstETH Oracle Change
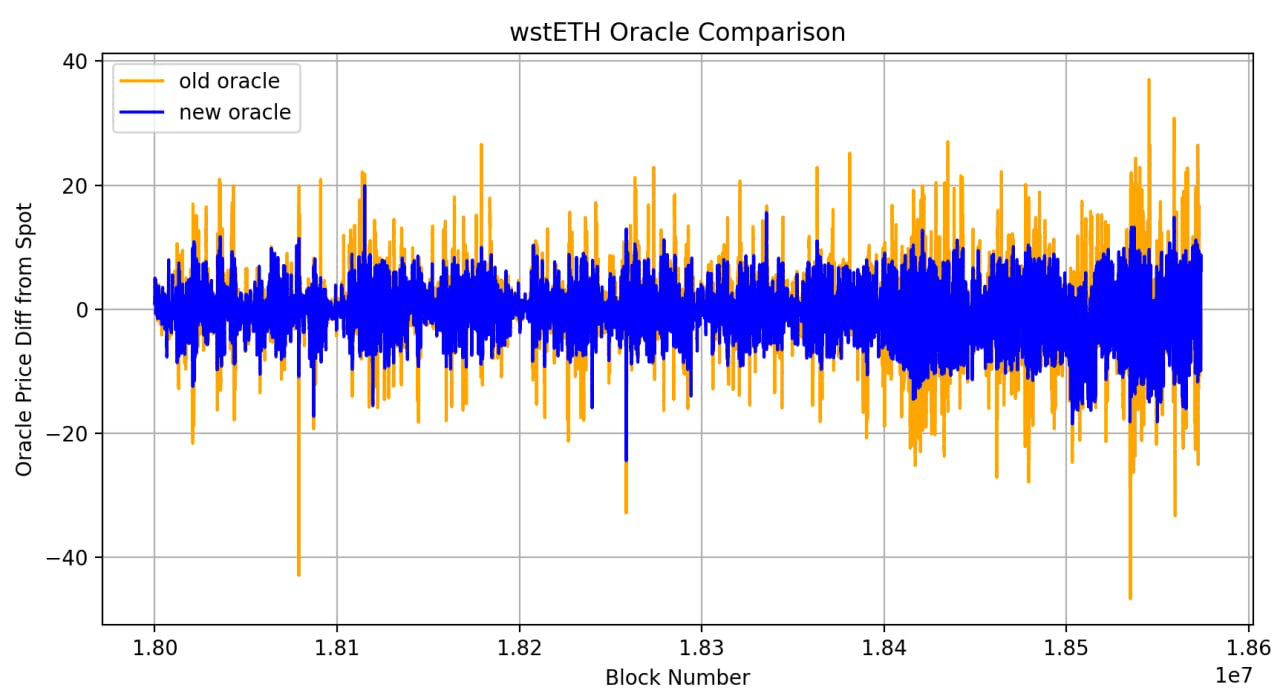
A proposal was passed to change the Prisma Oracle feed for pricing stETH. Initially, Prisma utilized the Chainlink stETH/USD oracle with a 1% deviation threshold for the wstETH TroveManager. There was found to be an improvement in switching to use a combination of the Chainlink stETH/ETH & ETH/USD Oracles, each with 0.5% deviation thresholds.
See below the deviation of the new Oracle vs old Oracle with a 15 block resolution:
Source: Chart by @wavey
There had been instances observed, when mkUSD traded below its peg, where excessive redemptions were taking place due to significant Oracle deviations surpassing 1%. In these instances, it was observed that the dynamic fee was insufficient to deter excessive redemptions because of the pricing deviations. See below the redemption fee adjustments in response to redemption events.
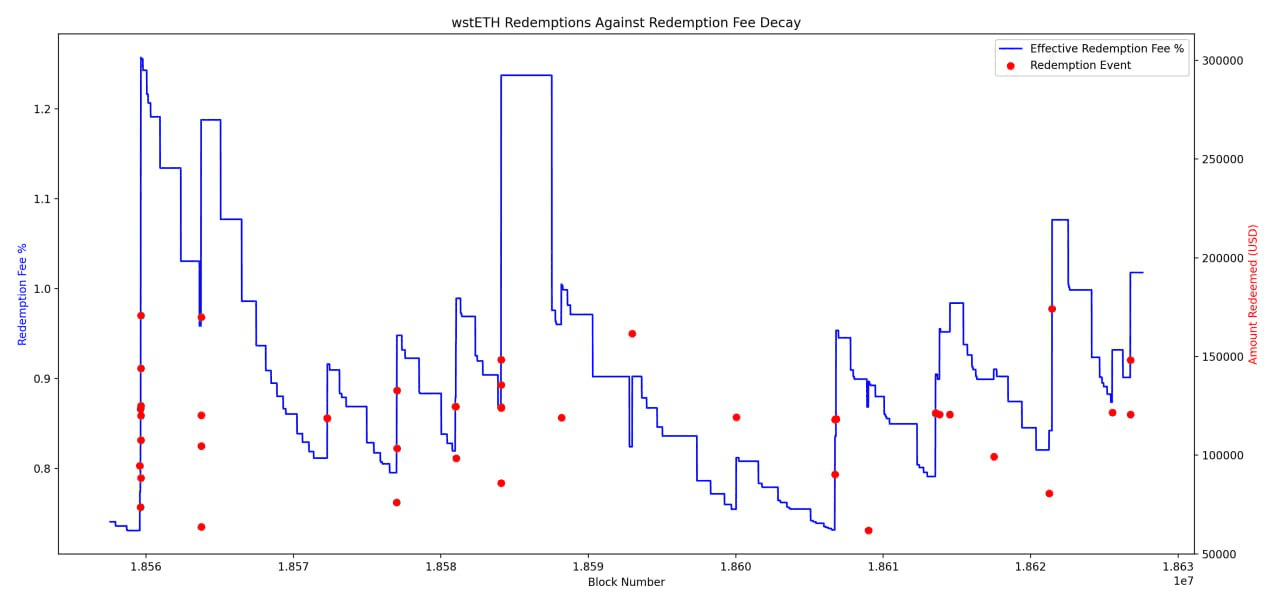
Source: Chart by @wavey
These redemptions may be incurring an indirect fee to Prisma users, who may be receiving an unfavorable rate when their trove is redeemed against. Wavey’s analysis indicates that the stETH/USD Oracle is more susceptible to deviation compared to the combined Oracles which is validated in the data presented above. Brief periods of deviations exceeding 1.2% occurred, creating opportunities for exploitation by MEV bots.
The proposal to change the Oracle (PIP-004) was executed on Nov-17-2023 07:15:35 PM +UTC with this transaction. Based on the mkUSD price chart below and the proposal execution date, it can be observed that the realized mkUSD price in USDC is lower after the proposal execution. It may be possible that the decreased profitability to redeem as a result of improving the Oracle has contributed to decreased peg strength.

Source: Dune query_5685458
There are likely other contributing factors that should be considered, including limitations in the protocol interest rate model, use cases for mkUSD, and incentives misalignment. Another important proposal that has served to limit redemptions is PIP-019, executed on January 31st. The proposal increased the base redemption fee to 1%-1.5% on all TroveManagers, which decreases peg resiliency of mkUSD with the tradeoff of reducing the risk of redemption for Prisma trove owners.
#Section 2: Oracles Residuals Analysis
#2.1 Goal
This analysis seeks to identify the performance of the implemented Prisma Oracles and to evaluate the hypothetical performance of an alternative on-chain Curve EMA Oracle using historical data. The findings will offer preliminary insights into the behaviors of off-chain vs. on-chain Oracles that will allow for more nuanced assessments in subsequent studies.
The goal of this analysis is to determine whether the current Oracle offers the most performant solution or if improvements could be made by implementing an on-chain or hybrid solution, making use of the Curve EMA pool Oracle.
#2.2 Methodology
The analysis will focus particular attention on stETH, as it is the most adopted LSD with both established Chainlink price feeds and deeply liquid Curve pools. Other collaterals listed on Prisma are analyzed and findings are available for reference in Appendix B following the report.
Comparison analysis involves evaluating how closely the subjected data aligns with a reference data set. In this context, two data sets are considered: the data of interest (subjected data) and a reference data set. While we anticipate that the subjected data should closely track the reference, deviations can occur.
To quantify the alignment, we examine the residuals, which are essentially the differences between the subjected data and the reference data. The residual analysis aims to reveal patterns or trends in these differences.
While analyzing the residuals (deviations from a reference) there are observations made based on the Standard Deviation of the residuals. Standard Deviation (SD) is a statistical measure that quantifies the amount of variation or dispersion in a set of values. It provides an indication of how spread out the values in a data set are from the mean (average). A low standard deviation implies that the data points tend to be close to the mean, while a high standard deviation indicates that the data points are spread out over a wider range.
In our case, a mean closer to 0 is desirable, as it suggests that the subjected price feed is not over-estimating or under-estimating from the reference prices. However, a mean close or equal to 0 with a relatively high standard deviation suggests that the fluctuations may be significant, which is undesirable, as this is equivalent to a high magnitude of mispricing. An oracle price feed with mean equal to zero and minimal standard deviation is the ideal outcome, indicating that the price feed tracks the spot price with a high degree of accuracy.
In order to monitor and evaluate the accuracy of the oracle price derived from on-chain activity, we employ price quotes sourced from the most liquid trade destination, excluding Curve, as a reference for residual analysis. Specifically, price quotes obtained from Uniswap’s LSD/ETH pair serve as the primary point of reference in this context.
Our analysis includes two strategies to derive a Chainlink price for stETH. This is done because the original Chainlink stETH/USD feed was found to have a higher deviation than using stETH/ETH + ETH/USD. An update was made to the oracle following a governance proposal. Henceforth, analyses involving the improved stETH/ETH Chainlink price in ETH is referred as stETHv1 and a combined stETH/USD + ETH/USD feed (replicating the original stETH oracle performance, normalized to ETH) is referred to as stETHv2.
#2.3 Data Collection
For the purpose of analysis, data from the last quarter of 2023 (from block 18331000 to block 18931000 with 250 blocks as resolution of the data set) is taken from all the respective assets. This creates a data set of 2401 data points in time for all the assets.
The asset primary under consideration is stETH, as it is the currently accepted collateral type on Prisma that has both a Chainlink feed and Curve StableSwap-ng pool to reference against (Note: see Appendix B for an analysis of rETH and cbETH, which use an older CryptoSwap pool implementation). All the data is fetched by querying prices for the specified block range.
The Oracle prices are analyzed from the following sources:
Curve Finance Pools
Asset Pool Link steth 0x21e27a5e5513d6e65c4f830167390997aa84843a Curve Pool reth 0x0f3159811670c117c372428d4e69ac32325e4d0f Curve Pool cbeth 0x5fae7e604fc3e24fd43a72867cebac94c65b404a Curve Pool
Chainlink Price Feed
Chainlink Feed Address Link ETH/USD 0x5f4ec3df9cbd43714fe2740f5e3616155c5b8419 CL Feed STETH/USD 0xCfE54B5cD566aB89272946F602D76Ea879CAb4a8 CL Feed STETH/ETH 0x86392dc19c0b719886221c78ab11eb8cf5c52812 CL Feed RETH/ETH 0x536218f9E9Eb48863970252233c8F271f554C2d0 CL Feed CBETH/ETH 0xF017fcB346A1885194689bA23Eff2fE6fA5C483b CL Feed
The Uniswap pool addresses used as a proxy for spot price reference are given below:
Uniswap Spot Price
Contract Address pool_id Pair 0x88e6a0c2ddd26feeb64f039a2c41296fcb3f5640 ETH/USDC 0x109830a1AAaD605BbF02a9dFA7B0B92EC2FB7dAa wstETH/ETH 0x553e9C493678d8606d6a5ba284643dB2110Df823 rETH/ETH 0x840DEEef2f115Cf50DA625F7368C24af6fE74410 cbETH/ETH
To normalize LSDs to their underlying ETH, the internal LSD/ETH exchange rate is used:
Internal LSD/ETH Rate
Contract Address Name Function 0x88e6a0c2ddd26feeb64f039a2c41296fcb3f5640 wstETH stEthPerToken 0x109830a1AAaD605BbF02a9dFA7B0B92EC2FB7dAa rETH getExchangeRate 0x553e9C493678d8606d6a5ba284643dB2110Df823 cbETH exchangeRate
#2.4 stETH Oracles Residuals Analysis
#2.4.1 Chainlink vs Curve
In this section we compare the historical accuracy of both Chainlink stETH price feeds against Curve.
Chainlink stETHv1 Feed vs Curve Chainlink: stETH/ETH feed Curve: stETH/ETH pool
Below is a direct comparison of the prices sourced from Chainlink and Curve for stETH. Since Chainlink stETH/ETH has a heartbeat of 24 hours, the price lingers for every few blocks. The fluctuations can easily be observed in the Chainlink feed (better visualized in Chainlink stETH/USD feed) compared to Curve, as Curve uses an EMA time (ma_exp_time) of 10 minutes to derive its price.
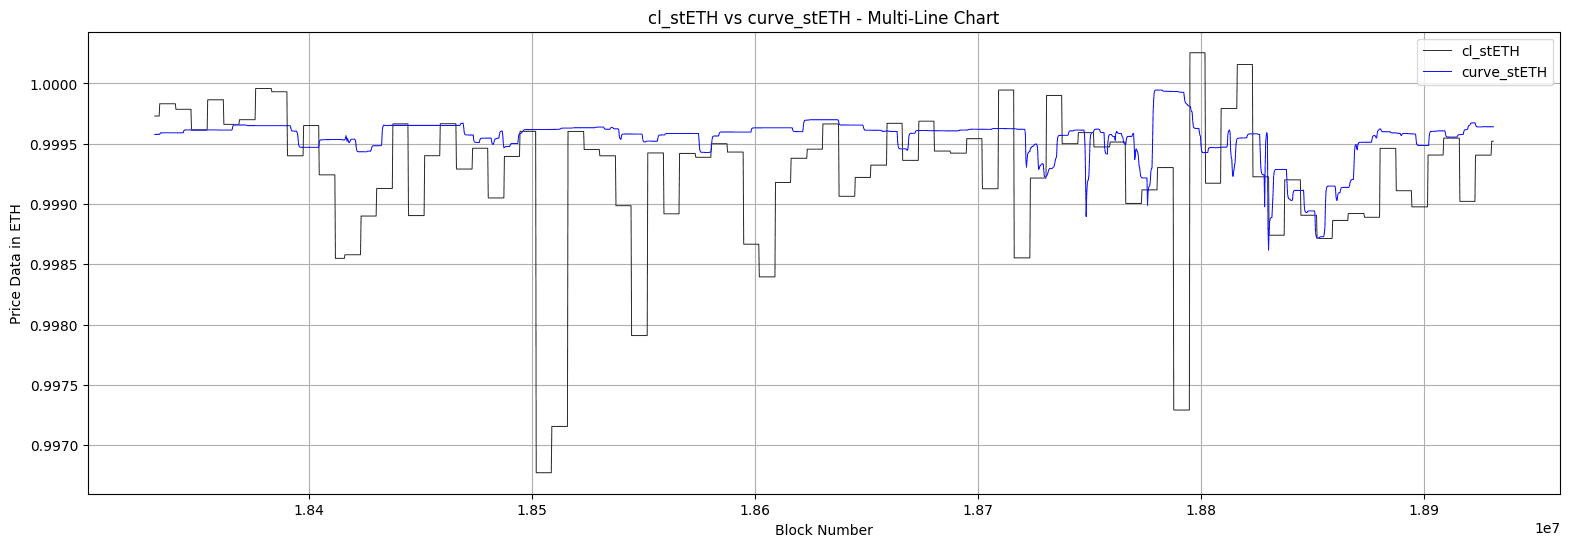
If we subtract Curve’s Price from Chainlink’s, we get the residuals, shown below:
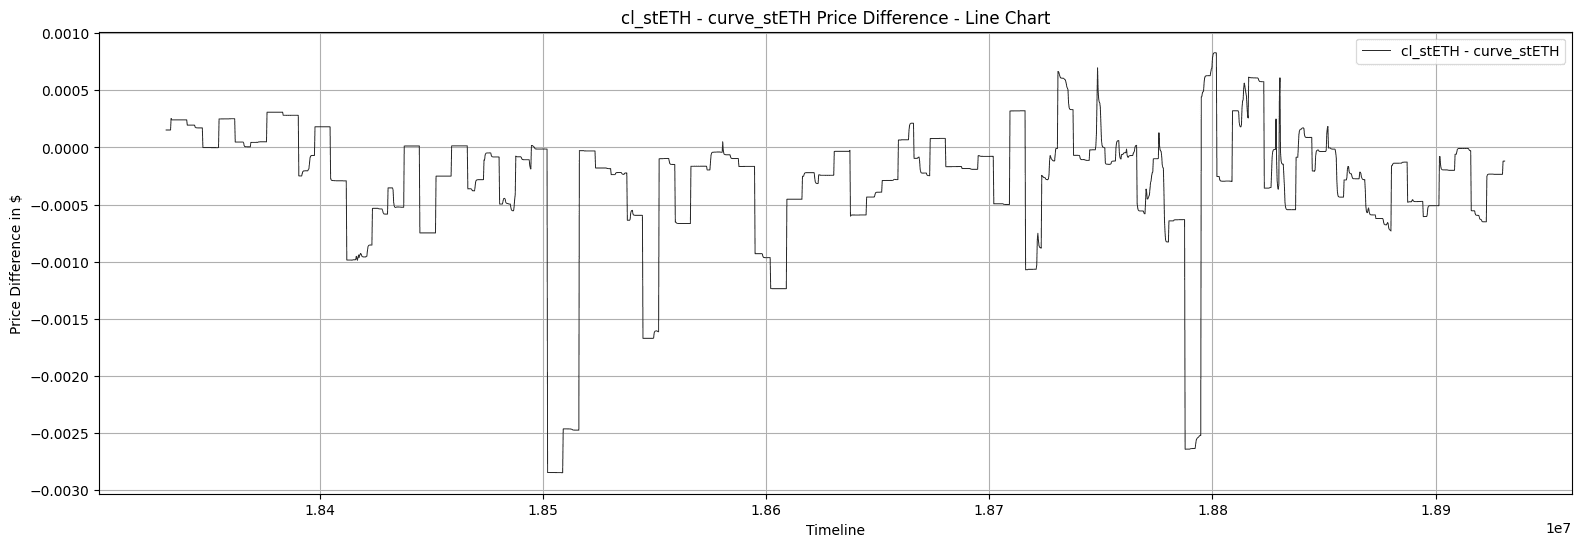
The mean of the deviation values is ~-0.000305.
An important observation which can be made here is that the Curve Oracle over-estimates the price data by a small margin compared to Chainlink’s.
Chainlink stETHv2 vs Curve Chainlink: stETH/USD feed / ETH/USD feed Curve: stETH/ETH pool
Below is a comparison of the prices sourced from an alternative Chainlink feed normalized to ETH (stETH/USD and ETH/USD) and Curve for stETH. Since Chainlink stETH/USD has a deviation threshold of 1% (compared to 0.5% in the stETH/ETH feed), the price exhibits larger deviations around the peg price.
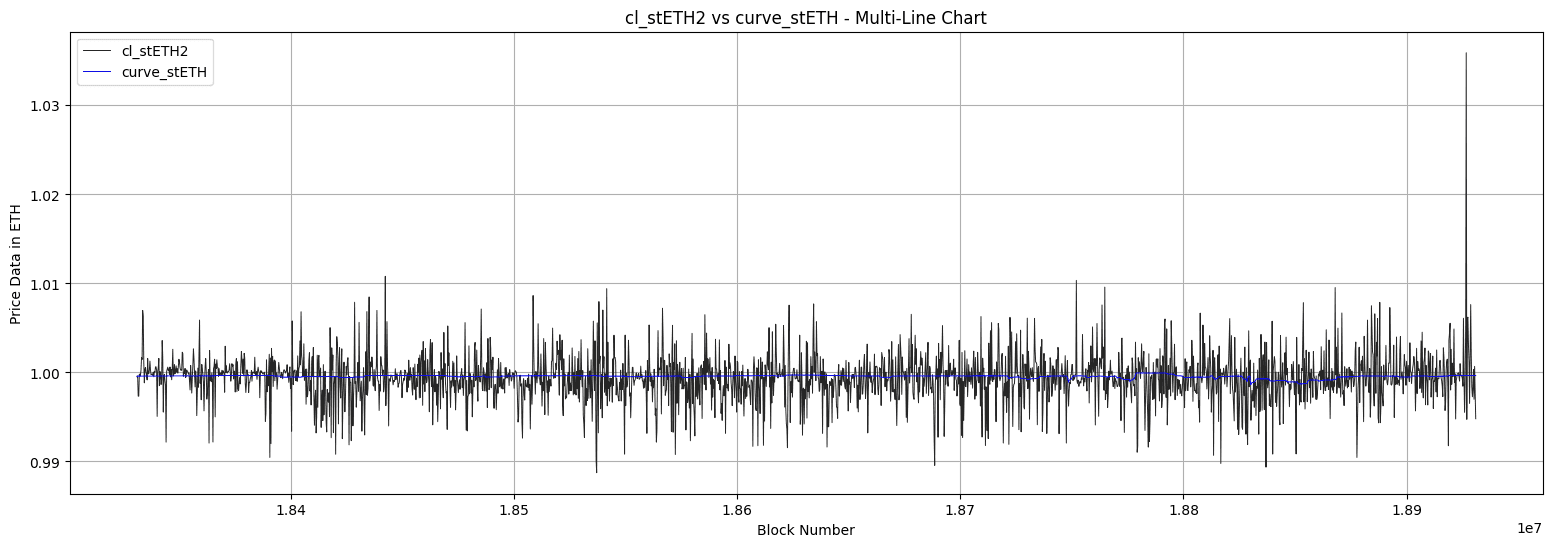
As observed earlier, the fluctuations are much more noticeable in the case of Chainlink’s price for stETH/USD compared to Curve.
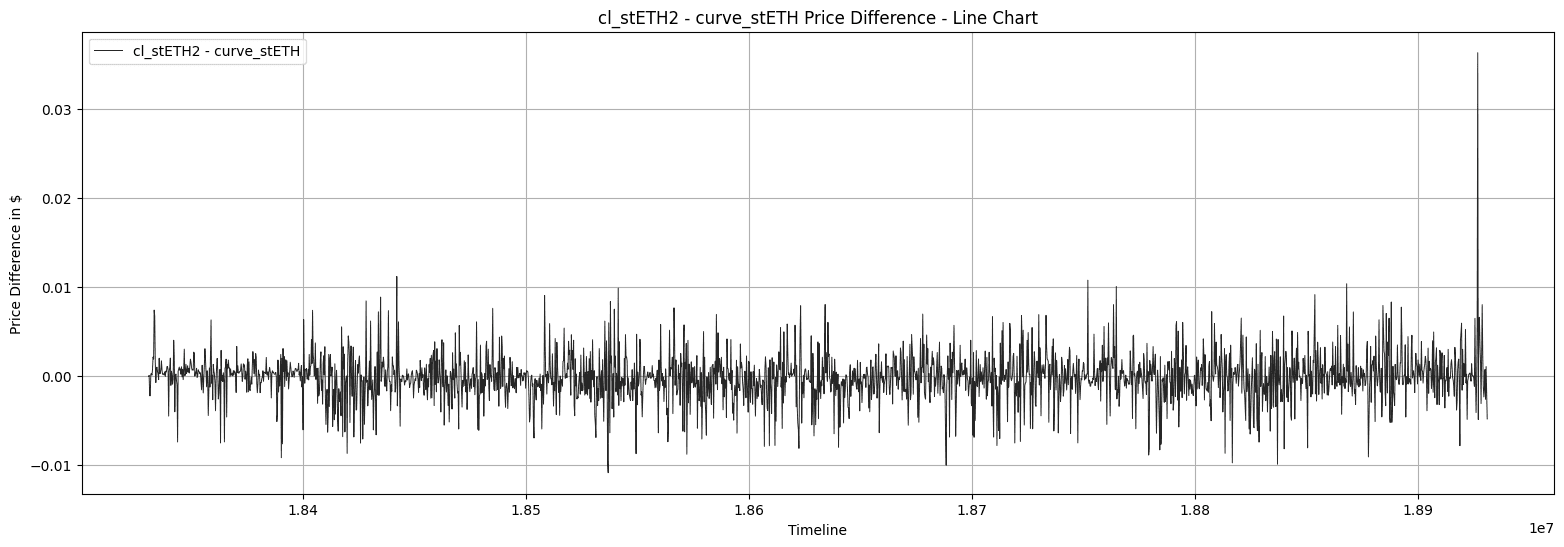
The mean of the deviation values is ~-0.000171.
Based on the scale, the residuals for this feed are greater i.e. greater magnitude of fluctuations compared to stETH/ETH.
#2.4.2 Uniswap vs Chainlink
In this section we compare the historical accuracy of both Chainlink stETH price feeds against a Uniswap reference spot price.
Assuming that the UniswapV3 pool price data is a reliable proxy for spot price, we can compare the previously obtained benchmark data to check how close the Chainlink Oracle feed gets to the reference.
Uniswap Spot vs Chainlink stETHv1 Chainlink: stETH/ETH feed Uniswap: wstETH/ETH pool / wstETH/stETH internal rate
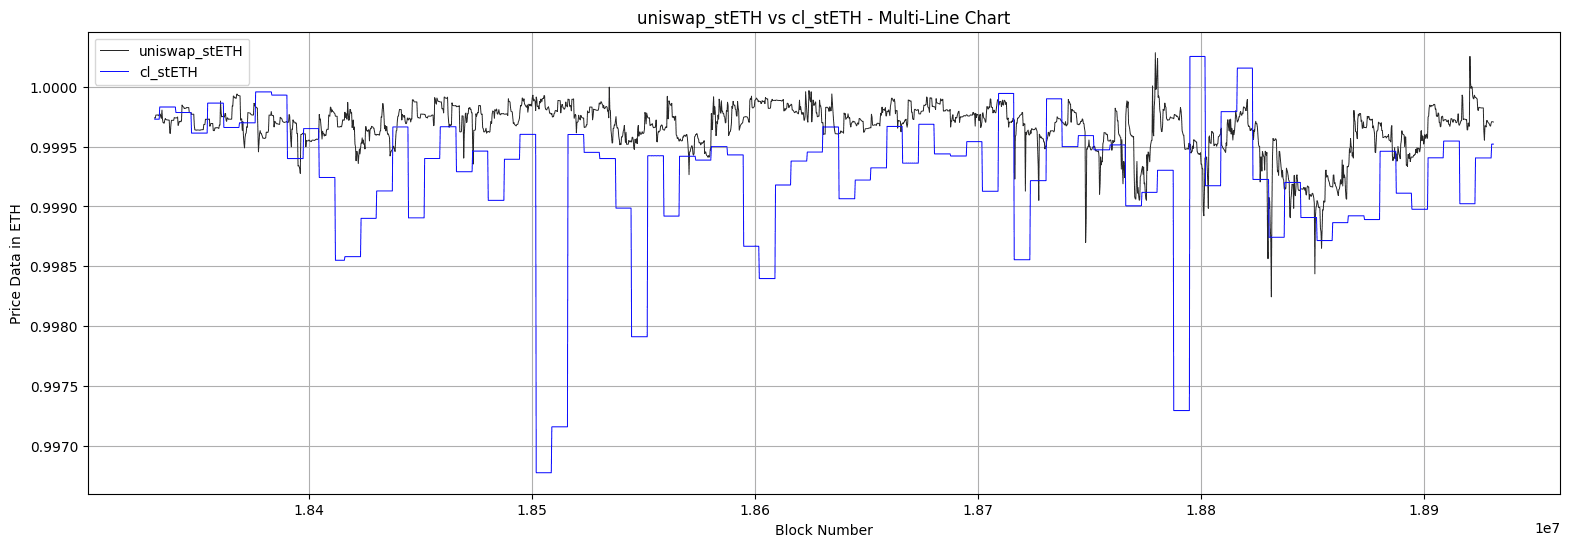
Here is the actual deviation between the Uniswap spot price and Chainlink stETH/ETH:
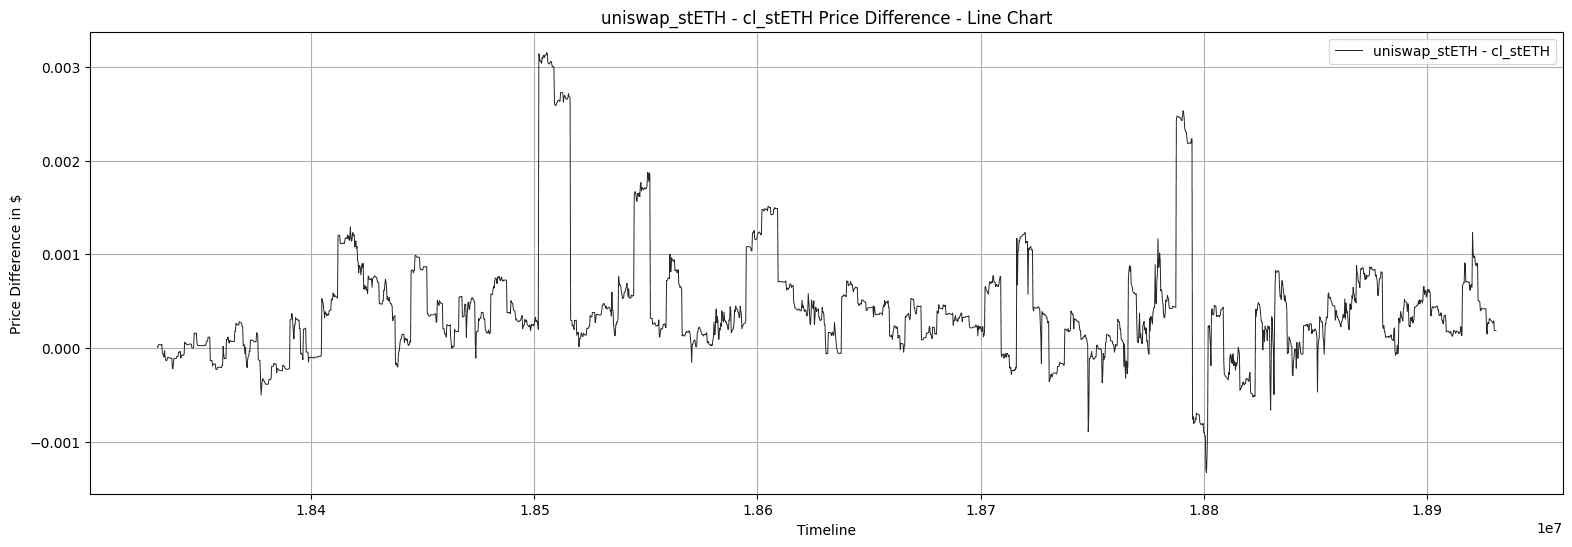
Mean of the Residuals = 0.000415 Standard Deviation of the Price Difference = 0.000601
Uniswap Spot vs Chainlink stETHv2 Chainlink: stETH/USD feed / ETH/USD feed Uniswap: wstETH/ETH pool / wstETH/stETH internal rate
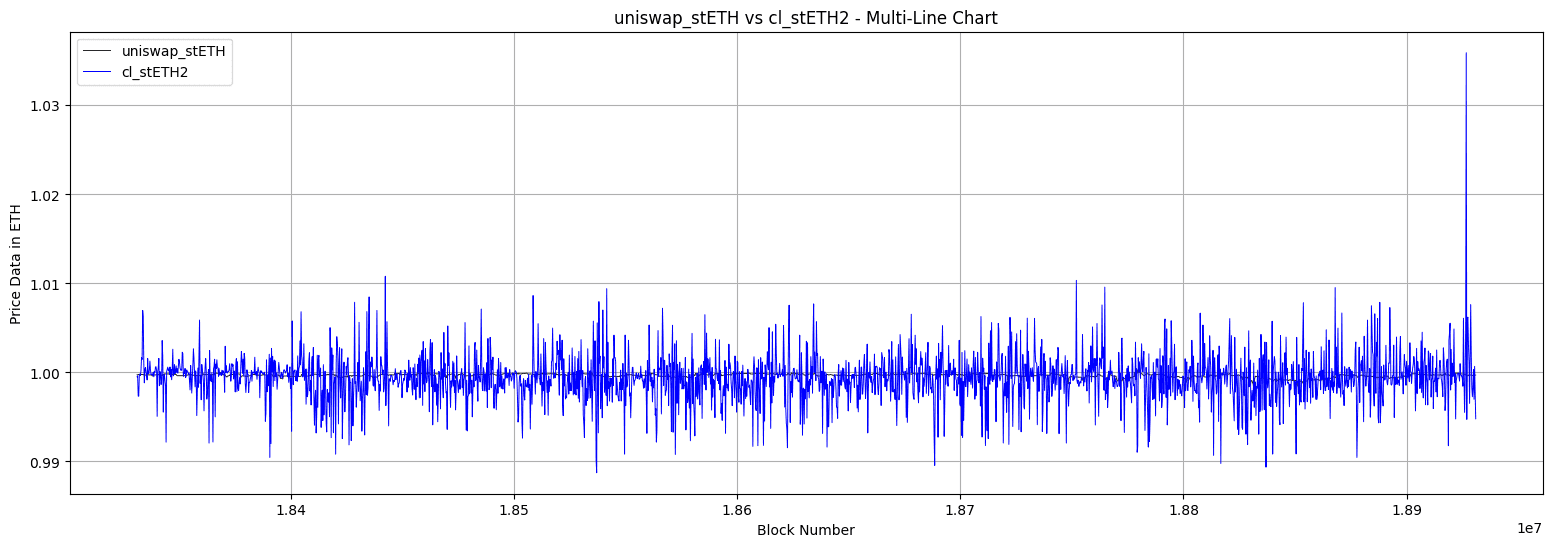
Here is the actual deviation between the Uniswap stETH and Chainlink stETH (stETH/USD):
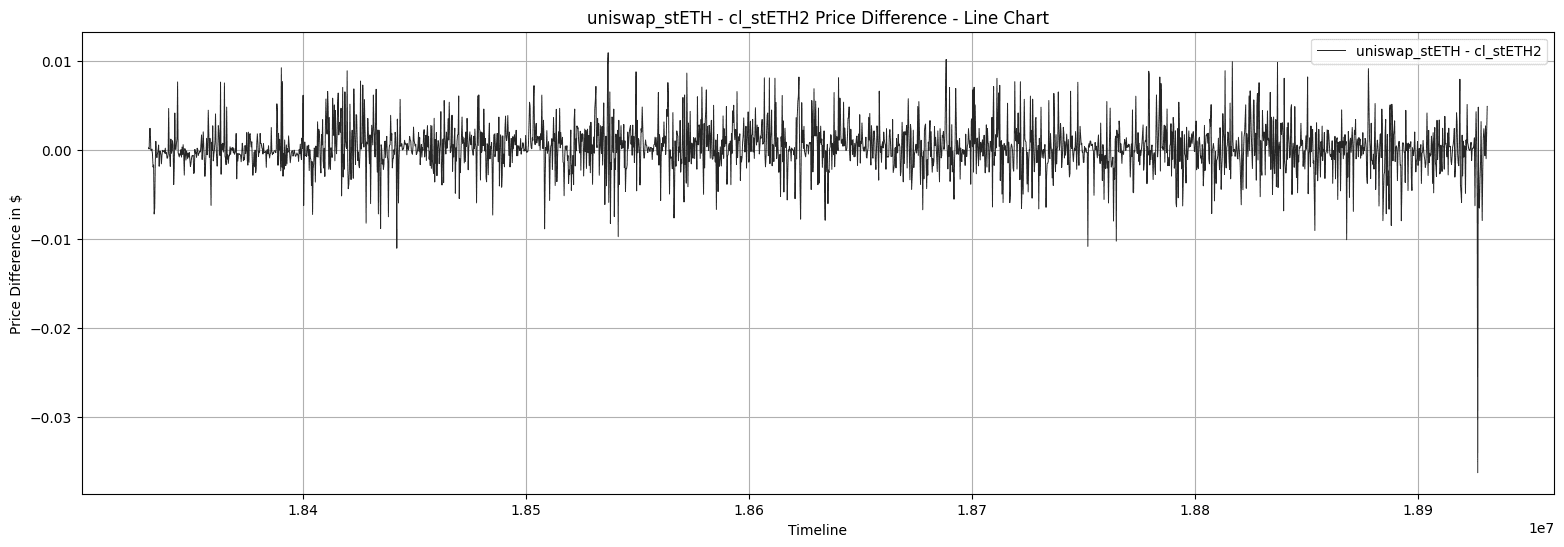
Mean of the Price Difference = 0.000281 Standard Deviation of the Price Difference = 0.002747
The comparison here for Chainlink stETHv1 (i.e. stETH/ETH) and stETH v2 (i.e. stETH/USD) with Uniswap data shows that stETHv2 deviations are substantially greater than stETHv1.
This same observation was made in a Prisma governance proposal (PIP-004) when the Oracle was switched from stETH/USD to stETH/ETH + ETH/USD to reduce the price quote deviation.
#2.4.3 Uniswap vs Curve
In this section we compare the historical accuracy of the stETH Curve Oracle against a Uniswap reference spot price. Assuming that the UniswapV3 pool price data is a reliable proxy for spot price, we can compare the previously obtained benchmark data to check how close the Curve Oracle feed gets to the reference.
Uniswap Spot vs Curve Curve: stETH/ETH pool Uniswap: wstETH/ETH pool / wstETH/stETH internal rate
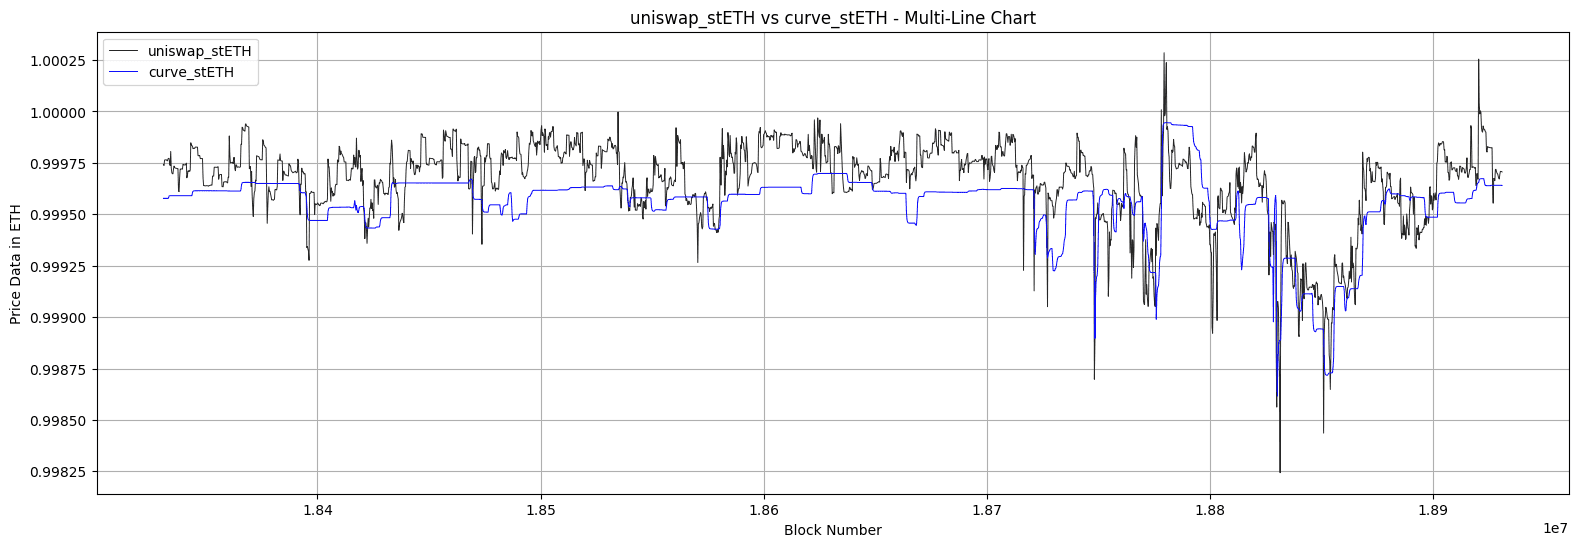
Based on a similar residual analysis as above, we get the following metrics to compare with the previously set benchmark:
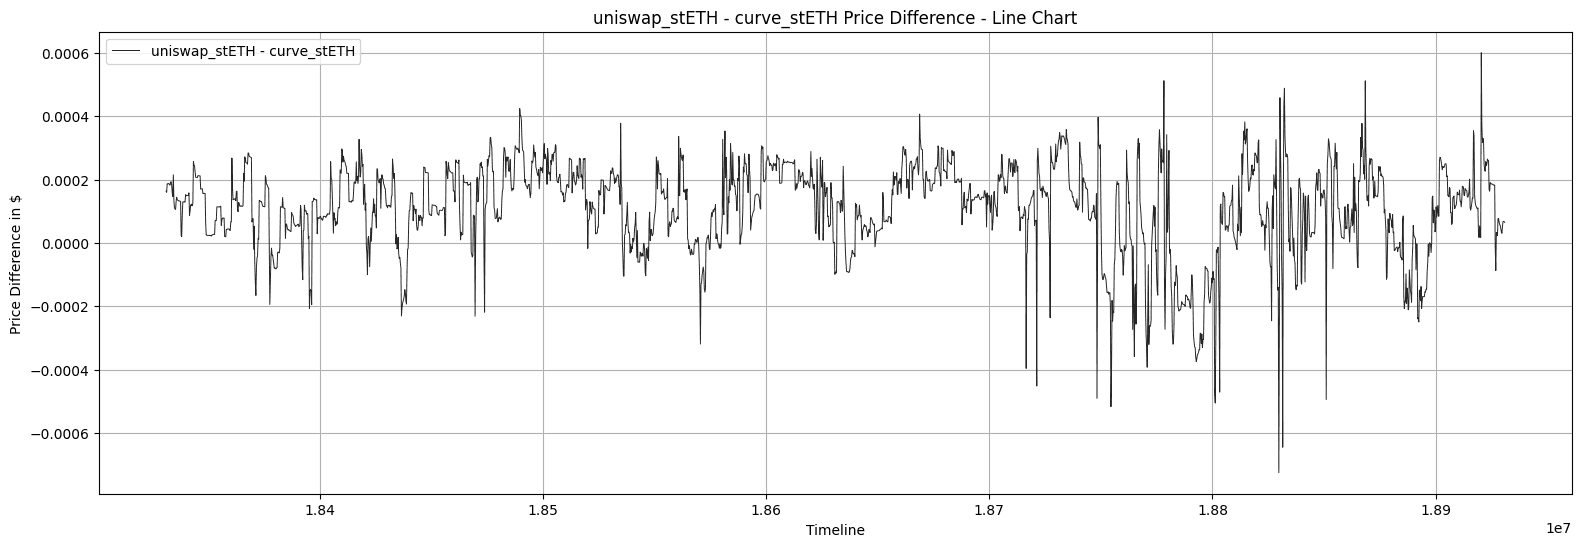
Mean of the Price Difference = 0.000110. Standard Deviation of the Price Difference = 0.000141.
Curve has been observed to report a mean price slightly lower than Uniswap spot with a standard deviation significantly lower than either Chainlink feeds.
#2.5 Results
On comparing the metrics, it is observed that the Chainlink data exhibits significantly more deviation than the Curve price_oracle when referenced against Uniswap data as a proxy for spot price.
Because the above observation is concluded from the deviations of individual price sources, it is possible that the Curve Oracle feed shows a positive deviation while Chainlink feed shows a negative deviation or vice-versa. This case is all together negated as the range of deviations in the case of Chainlink feeds & Curve Oracle is less compared to the deviation range of Uniswap & Chainlink and Uniswap & Curve.
The following table shows the residual analysis carried out for the gathered data. The mean of the residual multiplied by 100 gives the average % deviation (in USD from the ETH price in USD) for the subjected asset from the reference.
Reference Data Target Data Asset Mean Standard Deviation Uniswap Chainlink stETH 0.000415 0.000601 Uniswap Chainlink stETH2 0.000281 0.002747 Uniswap Chainlink cbETH 0.000710 0.000894 Uniswap Chainlink rETH 0.000133 0.001259
Reference Data Target Data Asset Mean Standard Deviation Uniswap Curve stETH 0.000110 0.000141 Uniswap Curve stETH2 0.000110 0.000141 Uniswap Curve cbETH 0.000076 0.000856 Uniswap Curve rETH -0.000002 0.000680
The table below directly compares the relative performance on mean and standard deviation between Chainlink and Curve against the Uniswap reference for each asset. In all cases, Curve exhibited lower mean and standard deviation values. The accuracy multiple shows the magnitude of the relative accuracy for each observed value.
Comparison Tighter Mean Mean Accuracy Multiple Tighter SD SD Accuracy Multiple CL stETHv1 vs Curve Curve 3.77x Curve 4.26x CL stETHv2 vs Curve Curve 2.55x Curve 19.48x CL cbETH vs Curve Curve 9.34x Curve 1.04x CL rETH vs Curve Curve 66.50x Curve 1.85x
The major takeaways here are as follows:
-
Based on the standard deviation of the residuals, Curve shows lower fluctuations compared to the reference spot price than Chainlink and is consistent across observed assets, although the standard deviation of cbETH was similar between Chainlink and Curve.
-
Based on the above tables, on analyzing the mean values, it is observed that Chainlink underestimates the price of assets compared to the reference Uniswap spot price. Curve is much more aligned to the reference, but also tends to slightly underestimate the price compared to the reference Uniswap spot price.
-
A caveat to these findings, as can be referenced in Appendix B: rETH/cbETH Residuals Analysis, is that although these Curve Oracles were observed to outperform Chainlink in general, rETH and cbETH experienced sharp, brief deviations. This is attributable to the pools’ relative illiquidity, low activity, and older pool implementation not suitable for integration. However, additional research is merited to determine baseline metrics required of a suitably reliable Curve pool Oracle.
#Section 3: stETH MEV on Redemptions Analysis
#3.1 Goal
This analysis seeks to identify the realized price upon redemption events in the wstETH TroveManager compared with the hypothetical price quoted by an alternative on-chain Oracle using historical data. The findings will offer preliminary insights into the behaviors of off-chain vs. on-chain Oracles that will allow for more nuanced assessments in subsequent studies.
The goal of this analysis is to determine whether the current Oracle offers the most performant solution within the specific context of redemptions or if improvements could be made by implementing an on-chain or hybrid solution, making use of the Curve EMA pool Oracle.
#3.2 Methodology
The analysis will focus particular attention on stETH, as it is the most adopted LSD with both established Chainlink price feeds and deeply liquid Curve pools. This study compiles all redemption events, comparing the realized stETH Oracle price with several alternative Oracles, priced in USD and taking the Curve stETH/ETH Oracle price.
For this analysis, realized stETH price is computed by dividing the quantity of mkUSD redeemed by the stETH quantity lost by the Trove Manager in the form of wstETH. To determine stETH quantity, we need wstETH received in the redemption + wstETH spent as a fee and convert this to stETH. If any of the alternative feeds provide consistently lower profits to redeemers, we can say they are performing better than the realized price in terms of MEV.
The wstETH TroveManager is used to get all the transaction hashes when mkUSD was redeemed. Transactions in which mkUSD is received and burned by an address that redeems mkUSD is considered a BOT transaction. A detailed query of redemption events can be found here: Dune query_3352919. This Query plays an important role to get all the data from the BOT transactions.
#3.3 Data Collection
A Dune query is used to identify the BOT transactions which gets all the tx hashes, the realized wstETH exchange rates for mkUSD redemption, and the block numbers of redemption events. The obtained block numbers from the query are used as inputs to query the following data which is used to compare the current implementation with the Curve stETH price feed variations:
Data Contract Denominated in Curve stETH 0x21E27a5E5513D6e65C4f830167390997aA84843a ETH Curve ETH (tricryptoUSDT) 0xf5f5B97624542D72A9E06f04804Bf81baA15e2B4 USDT Chainlink ETH 0x5f4ec3df9cbd43714fe2740f5e3616155c5b8419 USD Uniswap ETH 0x88e6a0c2ddd26feeb64f039a2c41296fcb3f5640 USDC
Based on the above data we can construct 3 price feeds that use the Curve Oracle stETH/ETH price and merge it with ETH/USD to come up with stETH/USD. After this manipulation we have the following data which is primed to be used in visualizations:
Data Name stETH/ETH Price ETH/USD Price Units curve_uni_stETH_in_USDC Curve stETH Uniswap ETH stETH in USD curve_stETH_in_USDT Curve stETH Curve ETH (tricryproUSDT) stETH in USD curve_cl_stETH_in_USD Curve stETH Chainlink ETH stETH in USD
The above data gives the price of stETH in USD and can be analyzed against the realized stETH price for all the BOT transactions. The realized stETH (in USD) is simply the stETH price used to compute the amount of stETH offered per mkUSD upon redemption.
#3.4 stETH MEV on Redemptions Analysis
Following are 4 stETH price feeds (1 reference and 3 alternatives discussed above) for the blocks where the BOTs transacted. The realized price feed is the price from the implemented price Oracle i.e. Chainlink. This is compared against 3 feeds that uses Curve stETH/ETH as core. Here, a higher price quote would result in less value of stETH exchanged for the mkUSD redemeed and vice versa.
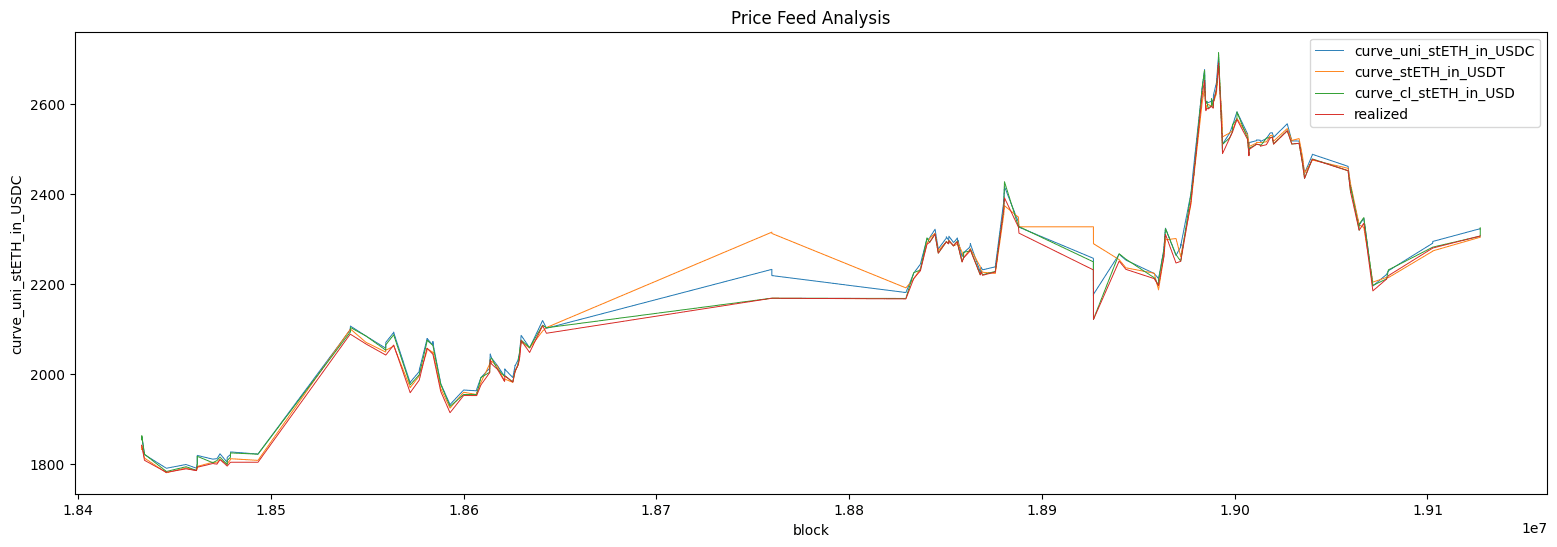
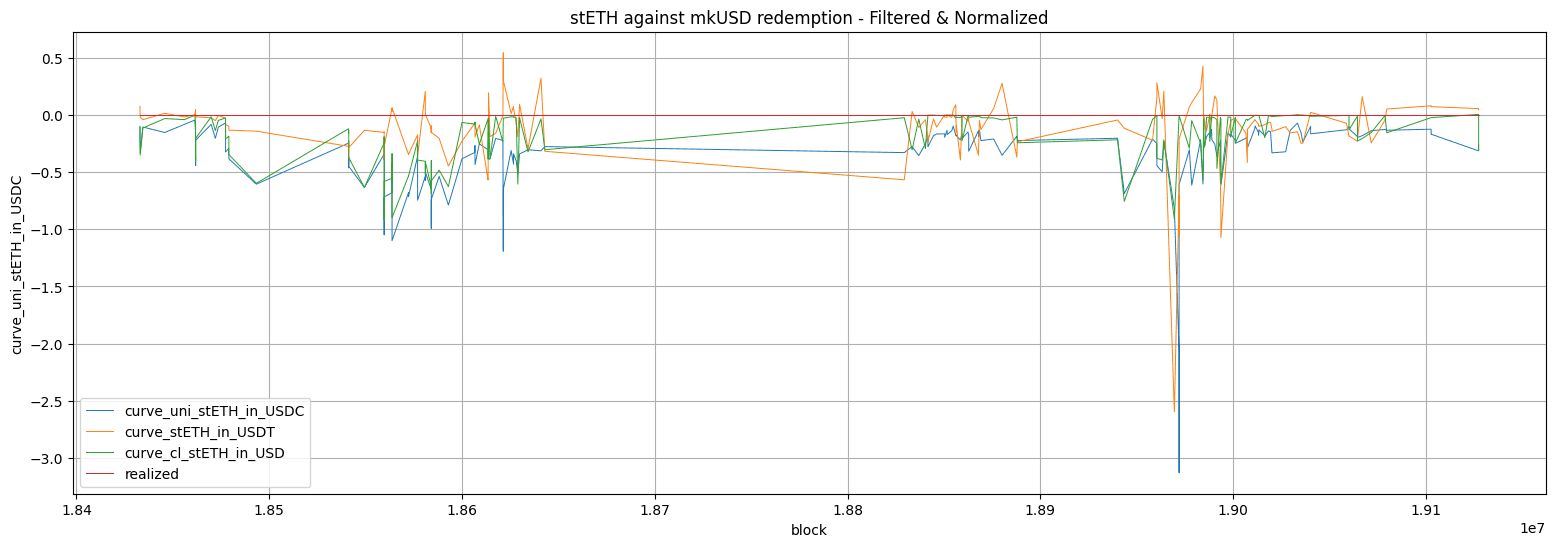
Given the above feeds, we can model the relative amount of stETH that would have been received from mkUSD redemptions, normalized against the actual amount received with the existing Oracle. The chart below shows the stETH gained from mkUSD before fees, with the data processed to remove outliers for improved visualization:
#3.5 Results
The analysis reveals a discernible trend: when utilizing Curve stETH/ETH in conjunction with Uniswap ETH/USDC and Chainlink ETH/USD, the quantity of stETH available for mkUSD redemptions diminishes. Consequently, fewer stETH units per mkUSD redemption translate to decreased BOT profits. The provided visualization illustrates the BOT profits under various hypothetical price feeds in contrast to the realized feed, excluding fees:
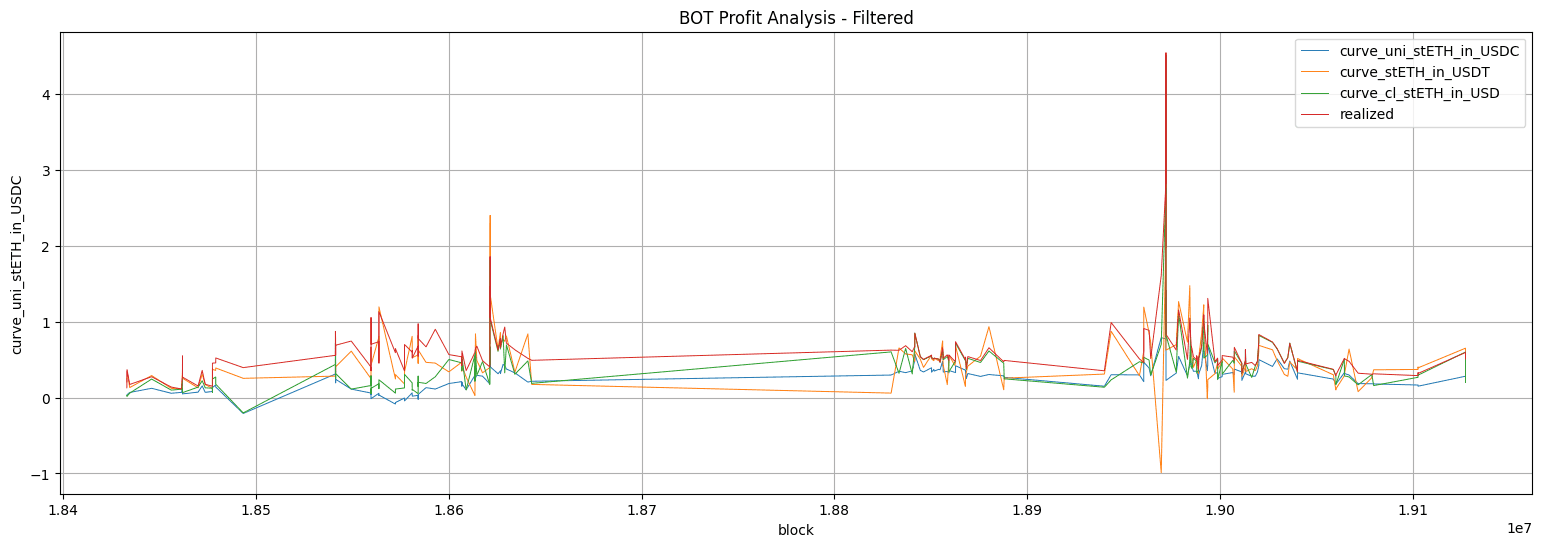
It’s evident that the combination of Curve stETH/ETH, Uniswap ETH/USDC, and Chainlink ETH/USD reduces redemption profitability compared to the realized price feed.
#Section 4: Proposed Oracle Improvement
#4.1 Hybrid Oracle Solution
Acknowledging the inherent risks of exclusively depending on the Curve Oracle, particularly during periods of low liquidity or liquidity fluctuations, the proposed solution integrates the Chainlink Oracle strategically as a safeguard (i.e. fallback) in the event of deviation. Given Chainlink’s negligible likelihood of providing erroneous data, it serves as a dependable fallback option.
The solution functions as a filter, considering both the Curve and Chainlink prices. A condition is established within a function, which acts as a switch. To design this condition, the concept of acceptable_range is introduced. This range represents the acceptable difference between Chainlink’s Oracle and Curve Oracle prices. When the observed difference surpasses this range, it signals a potential deviation or manipulation in the Curve Oracle data. In such instances, the function safeguards against potential risks by favoring the more secure Chainlink Price. On the contrary, when the difference falls within the acceptable_range, the function relies on the accuracy and precision of the Curve Oracle.
It is noteworthy that the acceptable_range can be configured as either static or dynamic, contingent on the volatility of underlying assets, such as ETH and the associated LSD. The dynamic nature allows for adaptability to fluctuating market conditions, ensuring a resilient and responsive mechanism for price determination. This dual-pronged strategy minimizes dependence on a singular data source, thereby bolstering the overall resilience and dependability of the pricing mechanism.
#4.2 Validating the Solution
#4.2.1 Static acceptable_range
The solution introduces a static acceptable_range to address potential vulnerabilities in relying solely on the Curve Oracle. While the Curve Oracle produces more accurate prices than Chainlink, it may be susceptible to manipulation. Chainlink, being robust and battle-tested, is considered a safer option in the industry. The acceptable_range serves as a threshold for switching to the Chainlink feed when the difference between the Curve Oracle and Chainlink exceeds a fixed value.
The acceptable_range is strategically set to accept the price quotes that are under +- 1% of what Chainlink quotes. This is almost 3 standard deviations from the mean difference between Curve and Chainlink (considering the improved stETH/ETH & ETH/USD feed as opposed to the previous stETH/USD feed).
#4.2.2 Function outputderived_price
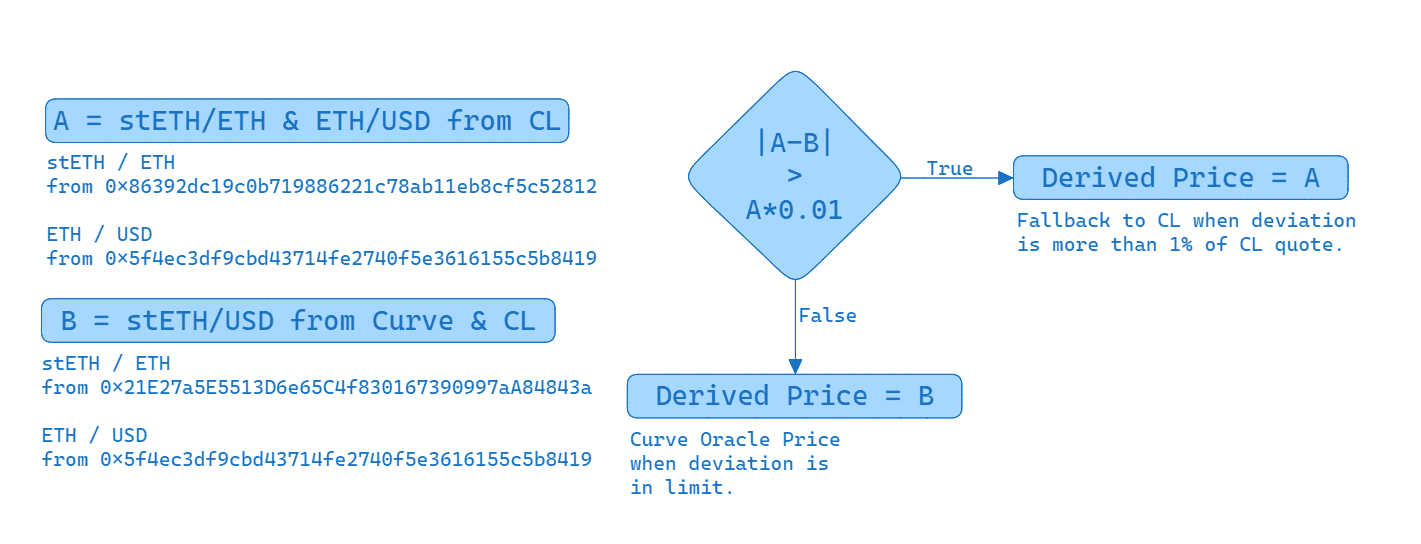
derived_price is the output of the function or mechanism designed to determine the final quoted price for a given asset, specifically in scenarios involving the Curve Oracle and the Chainlink Oracle.
In the described solution, the function evaluates the quoted price from the Curve Oracle and the Chainlink Oracle. Depending on the observed difference between these two prices and whether it falls within or exceeds the predefined acceptable_range, the function will output a different derived price.
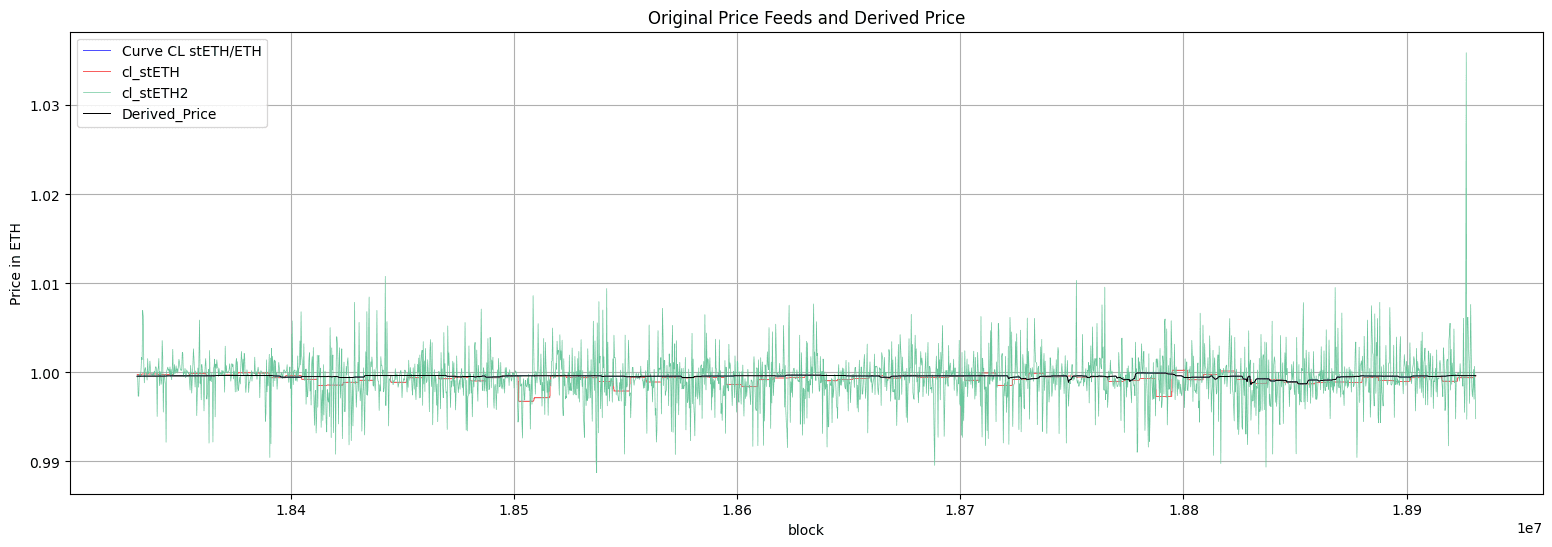
Here is how derived_price compares to other price feeds that were shown before:
BOT profits can be visualized with this derived price (which will be entirely equal to Curve stETH/ETH and CL stETH/ETH because of no deviations) as follows:
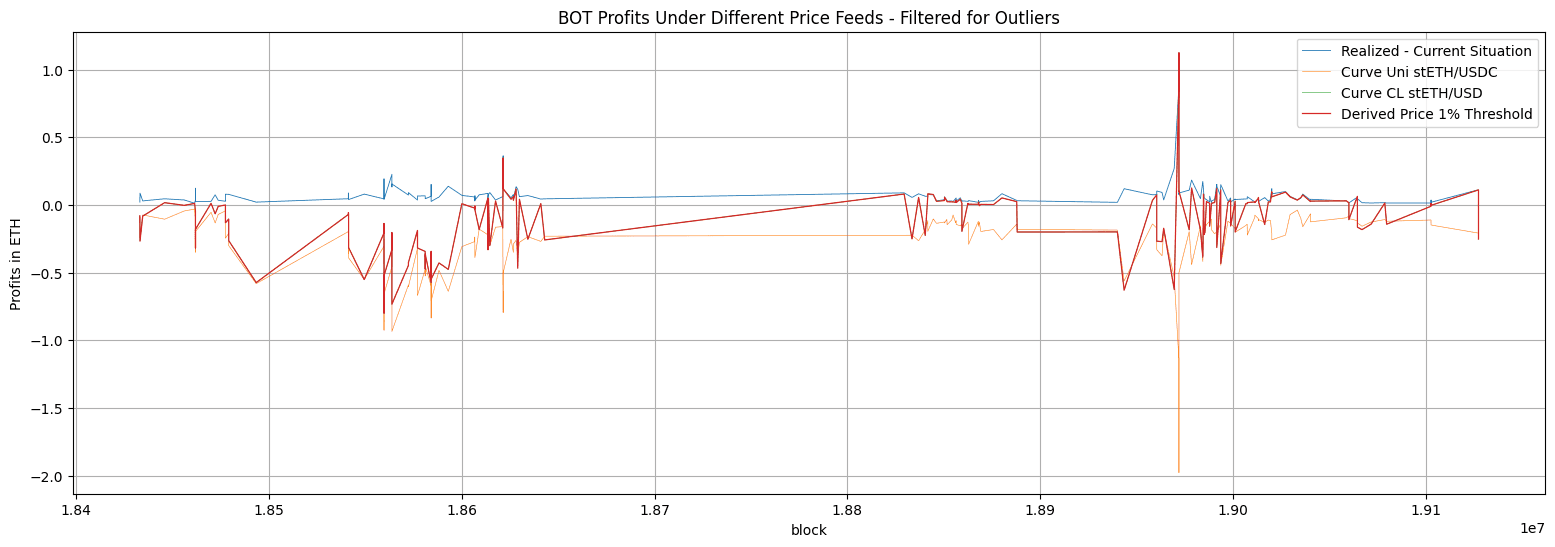
Analyzing the total profits can reveal the bigger picture. Six outliers were identified and the total profits are computed in each case before filtering for outliers and after filtration.
Price Feeds BOT Profits (Filtered) BOT Profits (un-filtered) Realized 13.759Ξ 26.999Ξ Curve Uni stETH/USDC -51.482Ξ -69.505Ξ Curve CL stETH/USD -18.880Ξ -8.407Ξ Derived Price 1% Threshold -18.880Ξ -8.407Ξ Derived Price 1.5% Threshold -18.880Ξ -8.407Ξ
The Curve stETH/ETH and Uniswap ETH/USDC performs the best when it comes to reducing the available profits for BOTs. The derived_price presents equal profit potential as the current implementation of Oracle for stETH but limits the profits, hypothetically saving users about ~35.4 ETH within 189 TXs analyzed.
#4.3 Conclusion
-
Since on-chain activity heavily relies on the prices quoted by decentralized exchanges with the most liquidity, and MEV bots redeeming mkUSD for LSDs follow the same quoted price, the accuracy of the quoted price (Oracle price used to quote redemptions) are of the utmost importance.
-
Based on historical data, the Curve pool Oracle price follows the reference (UniswapV3 Price data) much more closely than Chainlink’s price. The Data suggests that implementing the Curve Oracle would have resulted in decreased MEV by bots and provided a better exchange rate for users experiencing redemptions against their troves.
-
It might be tempting to use Curve Oracle as a stand-alone Oracle, but the effectiveness of the price feed from Curve is subject to the depth of liquidity for a particular asset and interactions with the pool. A blend of Curve Oracle and Chainlink Oracle can be used to match the prices on-chain while maintaining the reliability and broad market coverage inherited from using Chainlink Oracles.
-
Our proposed hybrid Oracle solution evaluates the standard deviation (SD) to produce a
derived_price. If the SD is closer to 0, it indicates that thederived_priceis following the reference and can be considered. This ensures that the solution dynamically switches to the more secure Chainlink feed when the Curve Oracle deviates beyond the predefined threshold. Because this solution would almost always output the Curve price quote for stETH, MEV activity is assumed to be the same as using Curve stETH/ETH with no fall-back.
#Appendix A: Data Processing Scripts
The scripts used to generate the analysis in this report are presented below:
-
OracleAnalysisV4: Colab notebook for data gathering
-
OracleAnalysisPlayground: Colab notebook for plotting charts with the pickle data file
-
PrismaOracleModelingV1: Colab notebook for plotting charts on MEV Activity on redemptions
-
DerivedPriceModeling: Colab notebook plotting alternative Oracle solution tests & modeling
#Appendix B: rETH/cbETH Residuals Analysis
#Misc Charts rETH
Chainlink vs Curve
Uniswap vs Curve
Uniswap vs Chainlink
#Inspecting the spikes rETH
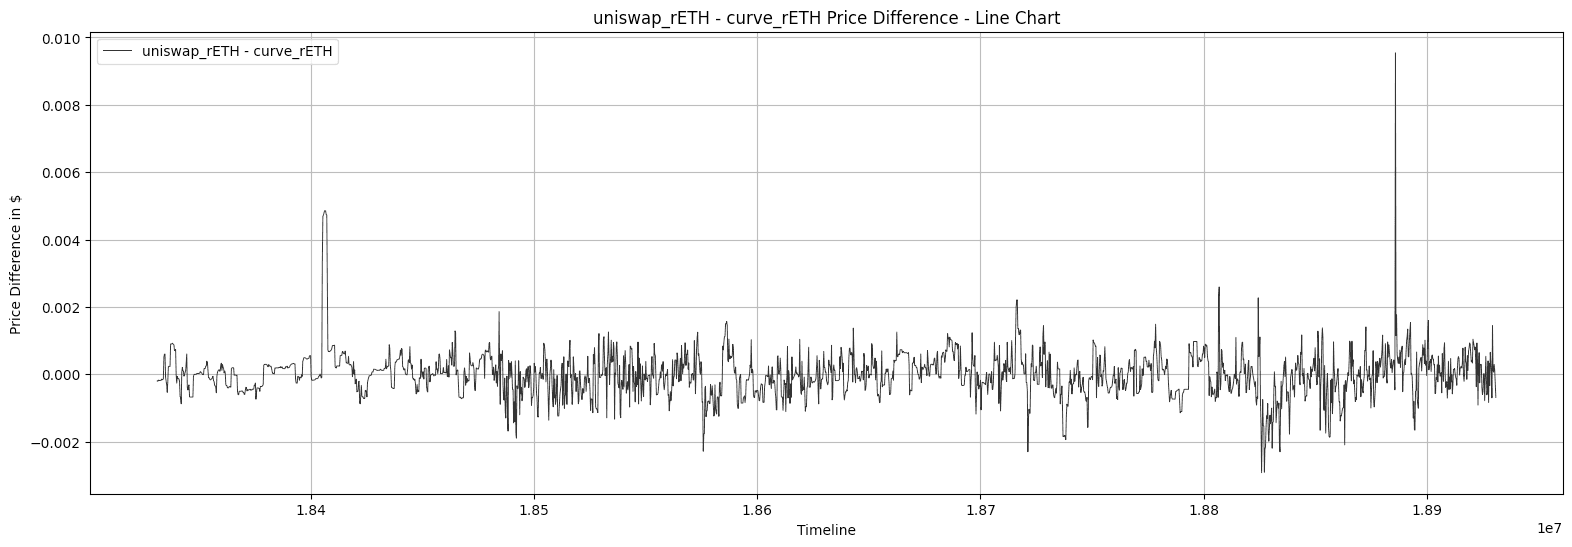
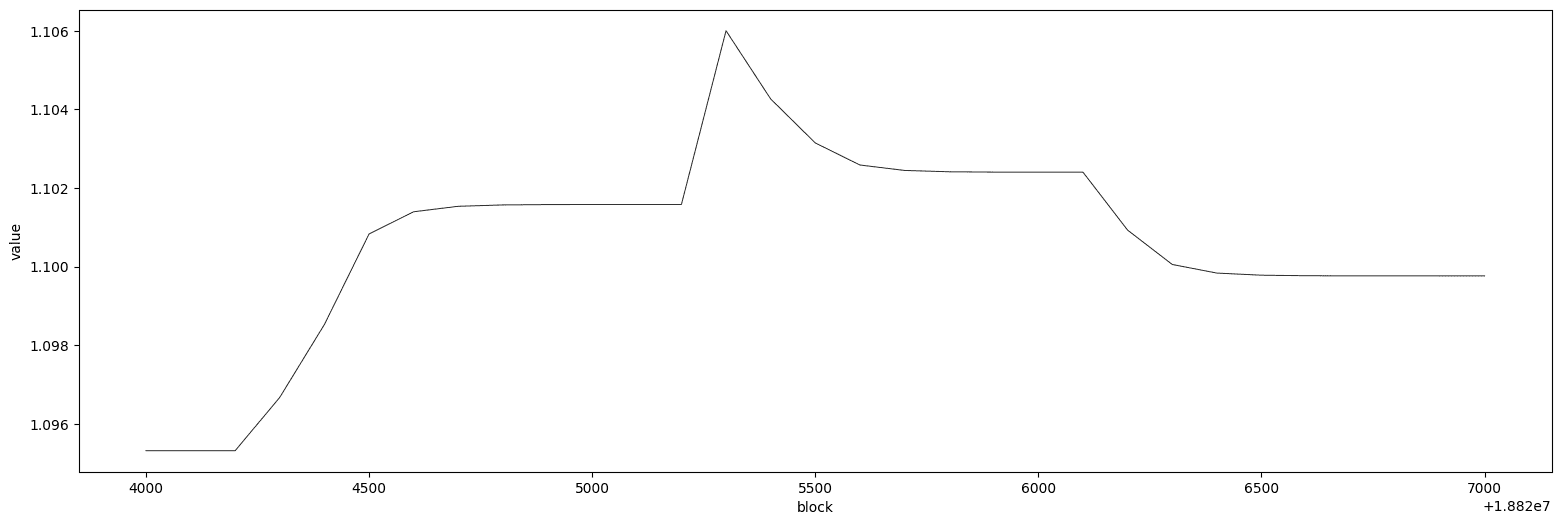
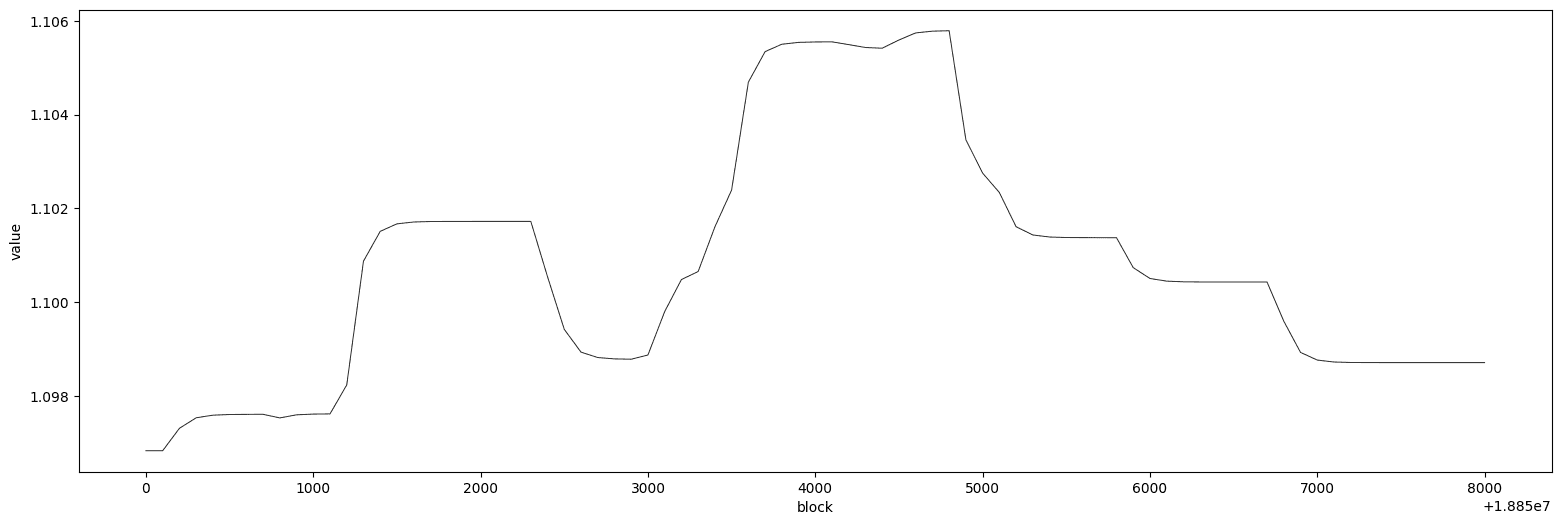
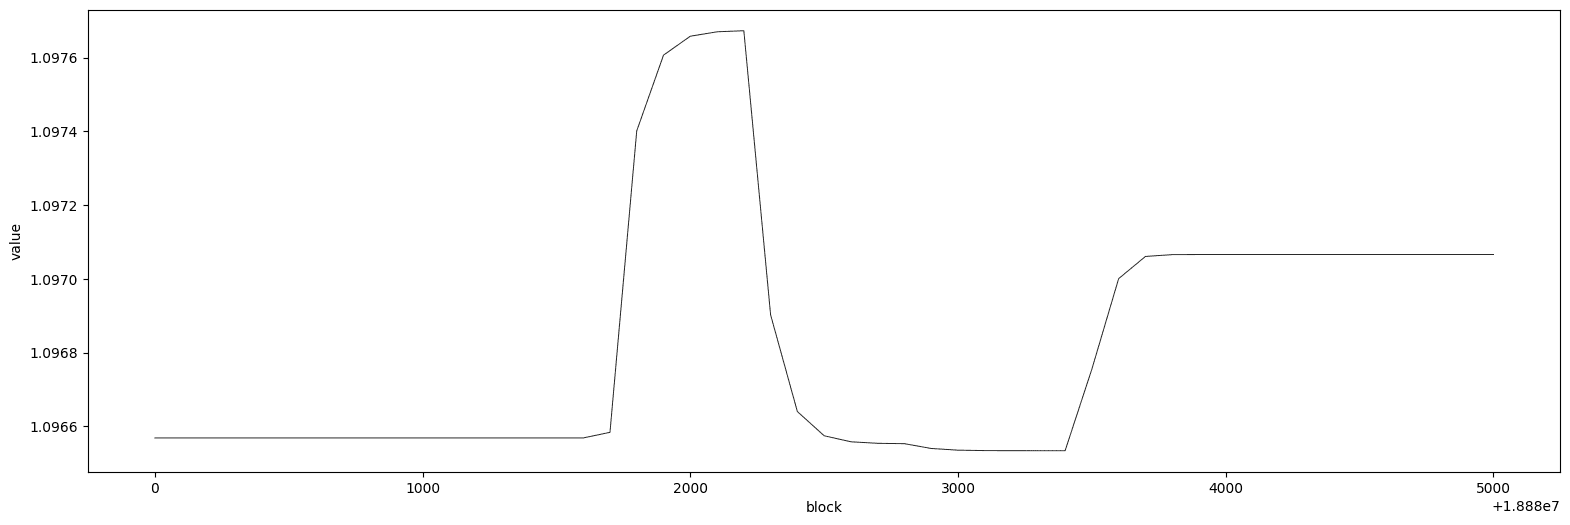
Several spikes in the rETH Curve Oracle price occurred over the observed period. On several occasions, this resulted in a price deviation spike between the Oracle price and the spot reference. Below are more granular charts looking at pool proportions/token liquidity around the time of several price spikes and behavior of the Oracle price.
Pool Proportion:
Oracle Price:
Pool Proportion:
Oracle Price:
Pool Proportion:
Oracle Price:
#Misc Charts cbETH
Chainlink vs Curve
Uniswap vs Curve
Uniswap vs Chainlink
#Inspecting the spikes cbETH
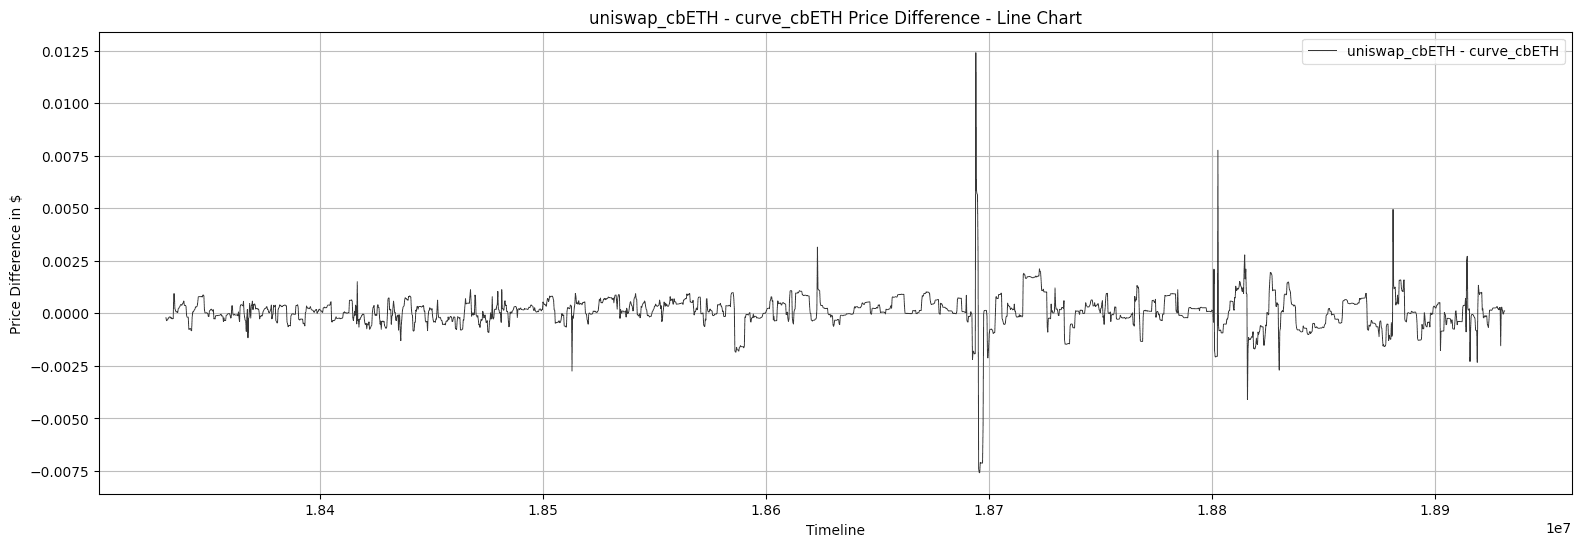
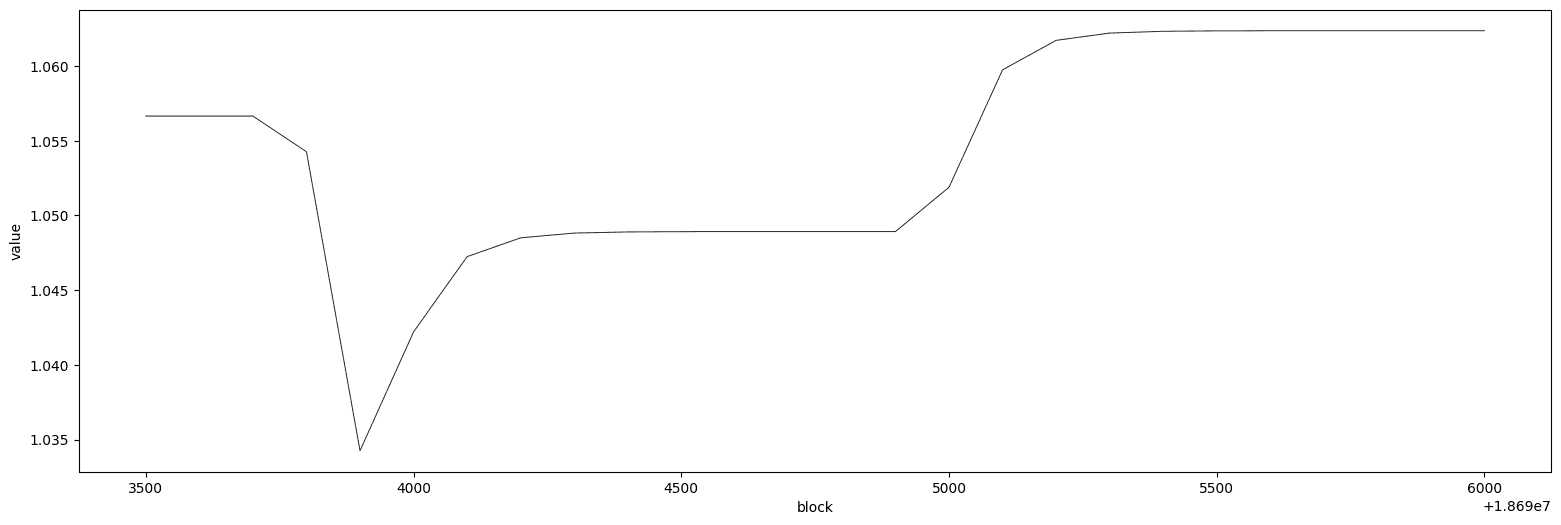
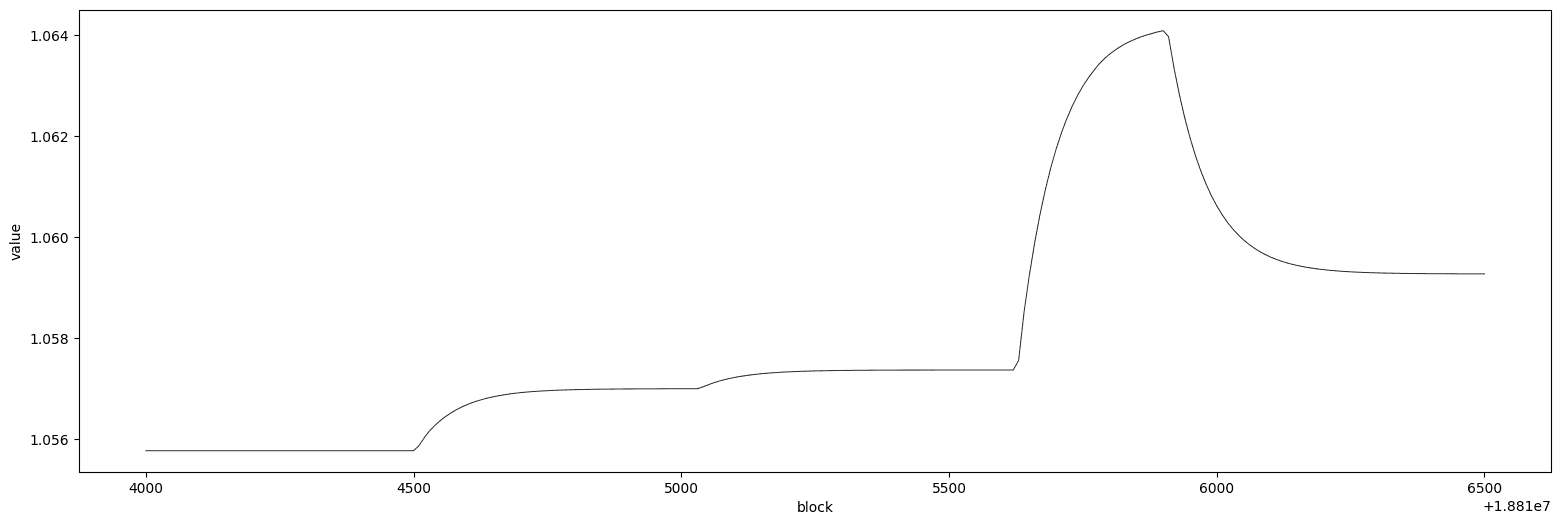
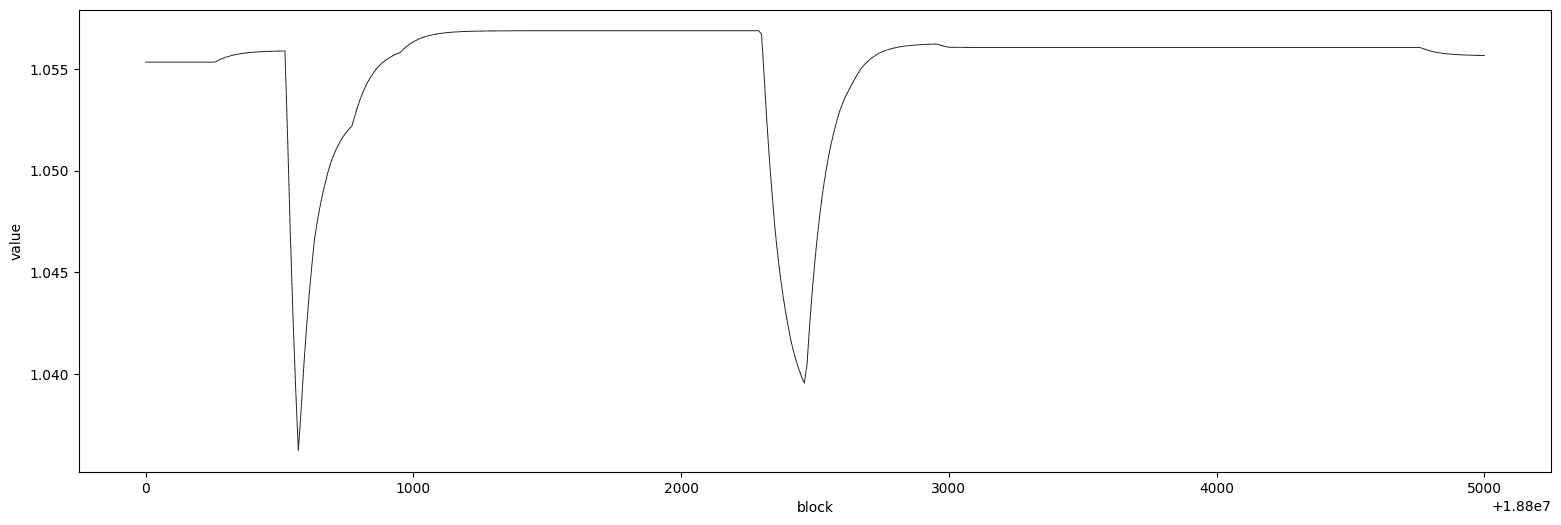
Several spikes in the cbETH Curve Oracle price occurred over the observed period. On several occasions, this resulted in a price deviation spike between the Oracle price and the spot reference. Below are more granular charts looking at pool proportions/token liquidity around the time of several price spikes and behavior of the Oracle price.
Pool Proportion:
Oracle Price:
Pool Proportion:
Oracle Price:
Pool Proportion:
Oracle Price:
Disclaimer: This report is an analysis that pertains strictly to optimizing the performance of the Prisma protocol. Recommendations should not be taken as universally applicable to third party protocols or use cases.
