
The methodology used to recommend a safe value for the Ethena Reserve Fund
Useful Links:
-
Drawdown Analysis: Interactive tool on the Ethena Risk Portal
-
Reference Notebook: Calculating Minimum Insurance Fund
#Overview
This research was conducted as part of our analysis of the Ethena Reserve Fund and its importance in preserving the protocol's solvency during adverse scenarios, such as perpetual futures rates turning negative.
Our methodology aims to determine the minimum Reserve Fund value necessary to mitigate potential losses from significant historic drawdowns in asset funding rates. We achieve this by analyzing historical funding rate data alongside real-time collateral values. By identifying and quantifying historical drawdowns, we calculate the requirements to ensure Ethena’s Reserve Fund is well-prepared to handle adverse market conditions.
#Extracting Drawdowns: Methodology and Rationale
- Reference Notebook - Extracting Drawdowns
#Process of Identifying Drawdowns
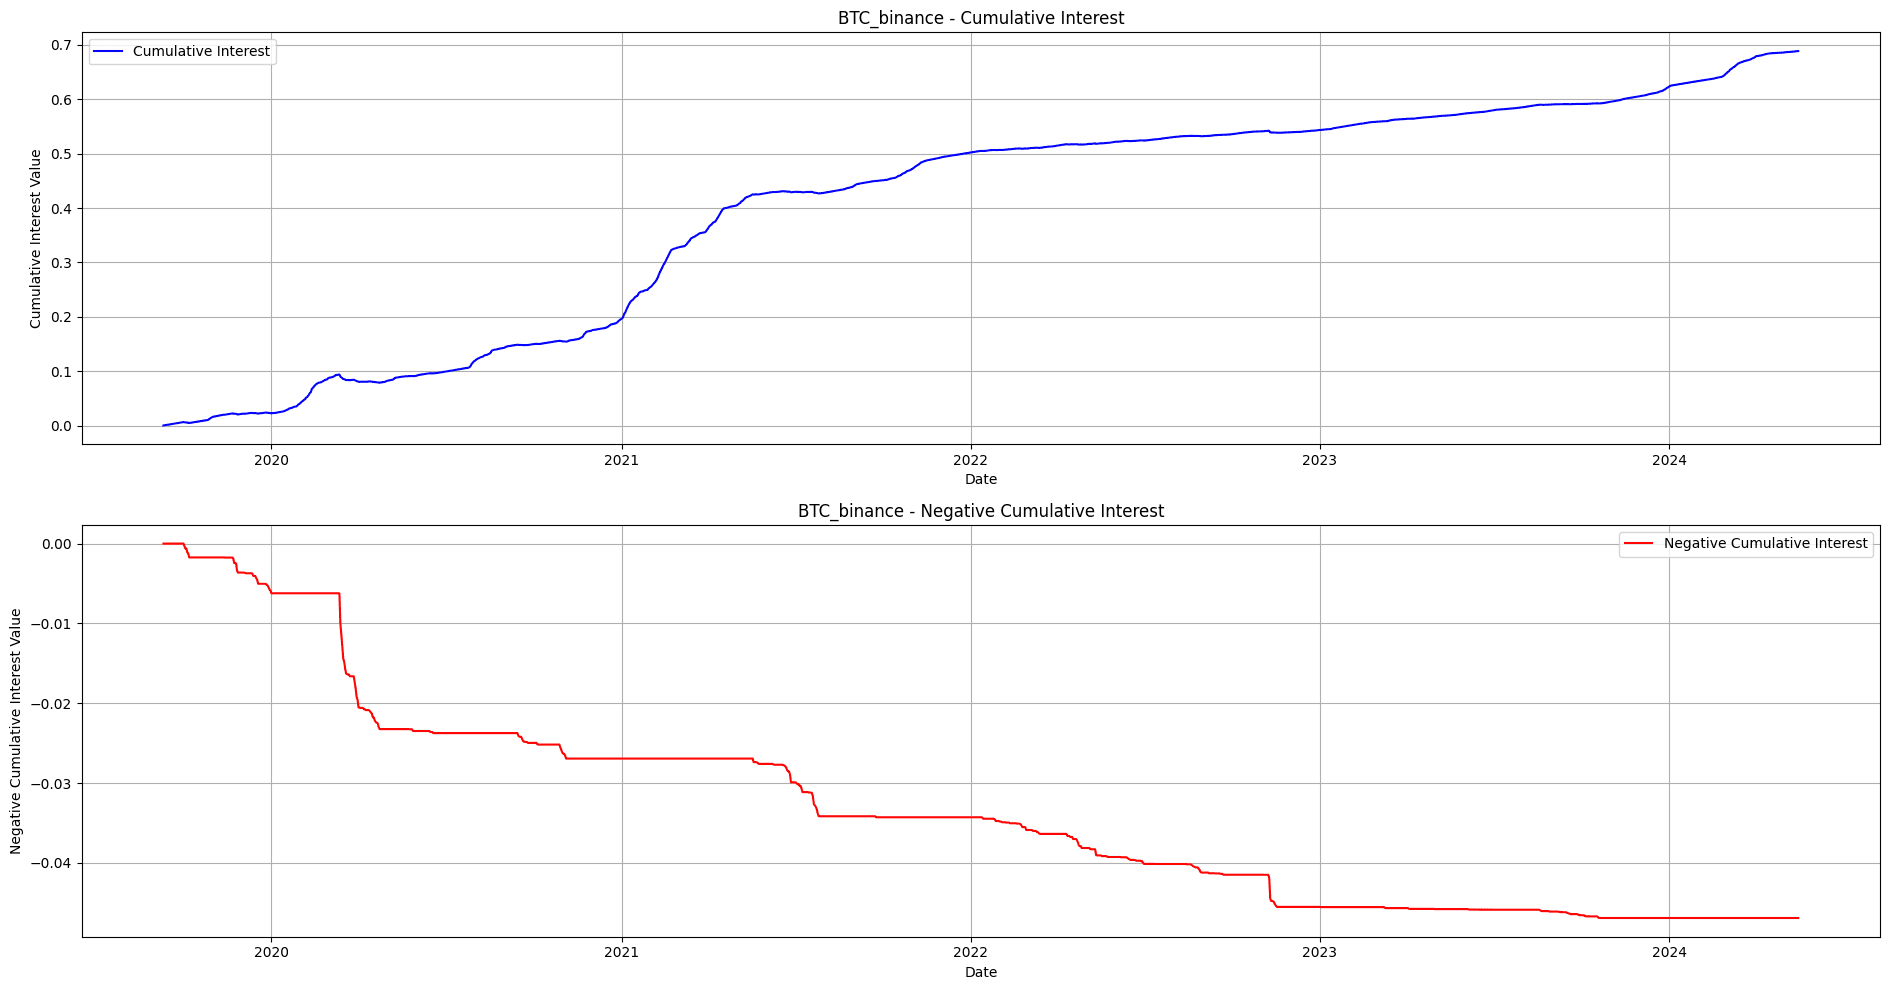
We initiated our analysis by modeling a hypothetical short open interest (OI) position starting with a value of $1. We then applied the full historical range of funding rates to this position to assess the interest impact over time. The dataset studied includes funding rate data up to May 2024, and for a short position worth $1, the net effect of the funding rates resulted in a gain of +0.7, thereby growing the position to $1.70. These fluctuations are visualized in a graph where the blue line indicates the cumulative gains and losses over time.
#Distinguishing Between Paying and Receiving Interest
To deepen our understanding, we segmented this graph into two distinct parts:
-
Periods When Paying Interest to Longs: Times when the funding rates were negative, and interest was owed.
-
Periods When Receiving Interest from Longs: Times when the funding rates were positive, and interest was received.
Both segments share the same x-axis (time), but our analysis primarily focuses on the first segment—when the short position incurs costs due to negative funding rates. This period is represented by the red line on the graph, isolating instances when interest payments to longs were made.
#Why Eliminate Positive Rates in Drawdown Analysis?
A critical aspect of our analysis is understanding why positive funding rates were not included when extracting drawdowns. At its core, a drawdown is a period marked by a high concentration of negative funding rates, reflecting times when the cost to maintain a short position is significant. Our primary objective was to identify periods where interest payments to longs (i.e., holders of the asset being shorted) were at their peak.
#Understanding Constant Cumulative Interest
On the red line graph, there are moments when the cumulative interest remains unchanged. These constant periods indicate two potential scenarios:
-
The Funding Rate is Zero: No interest payment occurs.
-
Receiving Interest from Longs: The interest payment is positive, and since the focus is on costs, these periods are excluded.
This delineation allows us to concentrate exclusively on periods when the short position is subject to negative funding rates.
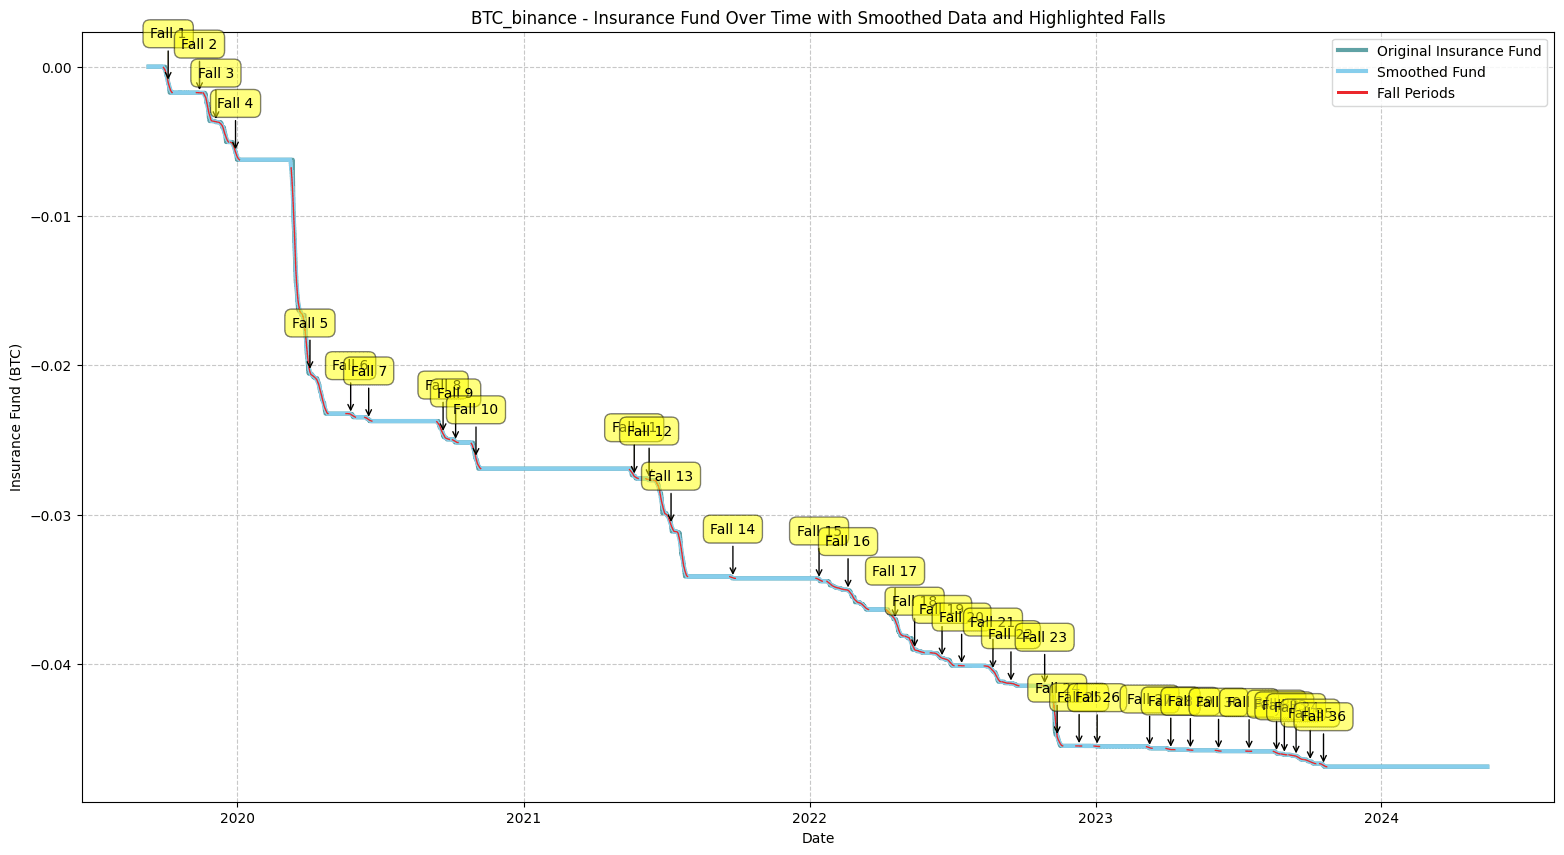
#Clustering Drawdown Periods
To isolate drawdown periods effectively, we target the sections on the red line graph where the cumulative interest is actively changing (i.e., declining). These sections represent times when the daily (or 8-hourly) funding rates are negative, leading to interest payments. Once these negative periods are identified, we group closely occurring declines into clusters. Specifically, falls occurring within a 7-day window are aggregated, forming the drawdown phases that are critical for calculating the insurance fund requirements.
#Calculating Reserve Fund Requirements
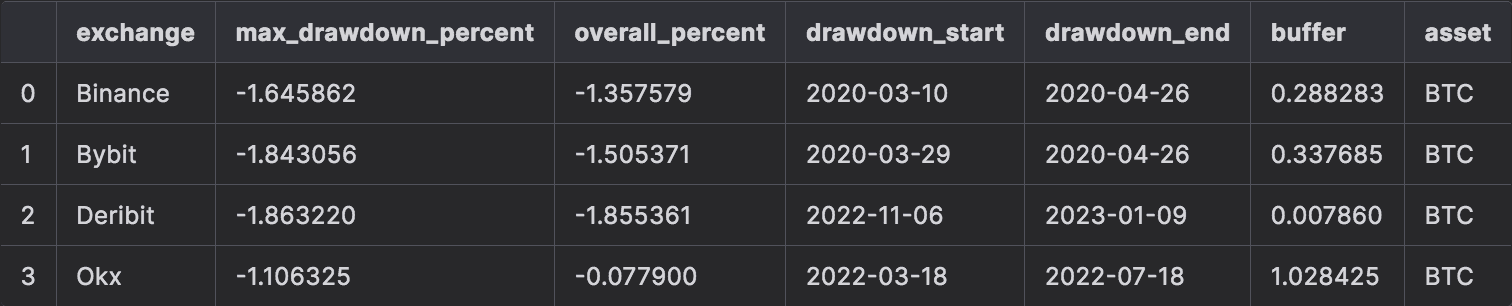
We conduct the drawdown analysis for each exchange that Ethena has positions. After extracting the max drawdowns for each of the asset's CEX pair, we extract the effect of that drawdown in the form of percent loss to interest payments. The max_drawdown_percent is computed as the difference between the cumulative interest for negative-only funding rates at the start of the drawdown and the end of the drawdown in percentage format. The overall_percent is computed as the difference between the cumulative interest for raw funding rates (unaltered rates) at the start of the drawdown and the end of the drawdown in percentage format. Following is a table extracted from the analysis made on BTC asset.
#Formatting and Reporting Results
The results are formatted to include:
-
Net Drawdown: This is the quantity computed using the overall_percent from the above table and the current allocation. It shows the minimum insurance fund required to survive the historic drawdowns (across all assets and exchanges happening simultaneously) given the current allocation across assets and exchanges.
-
Negative Rate Drawdown: This is the quantity computed using the max_drawdown_percent from the above table and the current allocation. It shows the minimum insurance fund required to survive the historic falls without accounting for any recovery in the funding rates. This adds a layer of conservativeness to the already computed Net Drawdown, as we are assuming there will be only negative rates, with all the positive rates set to 0 in the subjected drawdown.
-
Average Drawdown Duration and LST Return: This shows the yield expected from the ETH LSTs in the average duration of these drawdowns for the given input yield %.
By structuring the results this way, we ensure the insurance fund is equipped to handle market volatility effectively, leveraging both historical trends and current market data.
#The Takeaway
The drawdown analysis is an interactive app on the Ethena Risk Portal that gives the current Ethena position allocation across assets and exchanges. These values are configurable to experiment with Reserve Fund requirements under different conditions.
We use the output of the analysis to recommend a safe range for the Reserve Fund value, given the total OI across assets and exchanges, and accounting for the worst historical drawdown events for each variable. This gives us our Net Drawdown value and Negative Rate Drawdown value. The range between these values is our target zone, where the allocation to the Reserve Fund is sufficiently resilient to expected drawdown scenarios without diverting excessive funds away from core protocol operations. If the Reserve Fund value were to drop below the value given by the Net Drawdown, the Reserve Fund would be considered insufficient and we would alert Ethena to take action to replenish the Fund.