Collateral Selection and Parameterization for the $MONEY alpha deployment
#Introduction
Llama Risk is excited to begin a strategic partnership with Defi.money, a chain-agnostic stablecoin protocol based on crvUSD. The alpha launch of the protocol will begin with deployments on Optimism and Arbitrum and will involve an examination of several prospective markets suitable for each chain. We will conduct simulation and empirical analysis of prospective collateral types to advise Defi.money on establishing initial markets. The analysis specifically incorporates three focus areas:
-
Parameterization: Using the LLAMMAsimulator tool to determine optimal parameters for select markets.
-
Debt Ceiling: Conducting empirical analysis of liquidity conditions for proposed initial collateral types to determine sensible debt limits for select markets.
-
Oracle Selection: Backtesting the performance of several oracle options to determine an optimal oracle in terms of resiliency and performance for select markets.
These analyses have been used to form initial market recommendations for the alpha launch of Defi.money. Going forward, Llama Risk will continue its engagement by developing a more sophisticated agent-based model simulation tool that can further optimize the protocol. This will become more valuable in the coming months as Defi.money seeks to add additional collateral types, with a more advanced tool helping to mitigate market risks within the specific context of the LLAMMA liquidation algorithm. For now, we present the scope and recommendations relevant to the Defi.money alpha launch.
#Section 1: Scope and Methodology
#1.1 Asset Scope
The following assets on the respective chains are included in the scope of this analysis:
-
Optimism | WBTC, OP, $VELO
-
Arbitrum | WBTC, ARB, PENDLE, $RDNT
#1.2 Methodology
Analysis for the initial Defi.money markets recommendations involve three focus areas:
-
Parameterization: Determining optimal parameters for select markets
-
Debt Ceiling: Defining an optimal debt ceiling for select markets
-
Oracle: Determining an optimal oracle solution for select markets
#1.2.1 Parameterization
As a fork of crvUSD, $MONEY markets are instantiated with several parameters:
-
A: The amplification coefficient which defines the density of the liquidity and band size. Relative band size is 1/A. -
Fee: AMM fee in the market's AMM, which is charged on token exchanges. -
loan_discount: The percentage used to discount the collateral for calculating the maximum borrowable amount when creating a loan (i.e. the buffer between max loan-to-value and liquidation threshold). -
liquidation_discount: Discount defining a liquidation threshold. -
debt_ceiling: max stablecoin debt that can be minted within the market.
In order to provide an initial estimate for A, fee, loan_discount, liquidation_discount and debt_ceiling, we utilize existing simulation tooling and simple heuristics of on-chain liquidity conditions to arrive at relatively safe deployment parameters. The goal of this allow timely deployment of $MONEY markets for the launch of Defi.money.
For market parameterization, we use the LLAMMA Simulator. The LLAMMA Simulator is a simple simulation purely incorporating asset price data to arrive at optimal parameters for a given LLAMMA Market. We ran the simulation for the above-outlined assets and documented the parameters: A, fee, loan_discount, liquidation_discount. Given we purely focus on price data, there is no need to run chain-specific simulations.
Compute for the Llamma simulator is relatively high, which meant we had to decrease the sampling for OP, GMX, RDNT. For WBTC, and $WETH, existing and recent simulation results for curve markets were available. We deemed the results as preferential due to the higher sampling frequency.
#1.2.2 Debt Ceiling
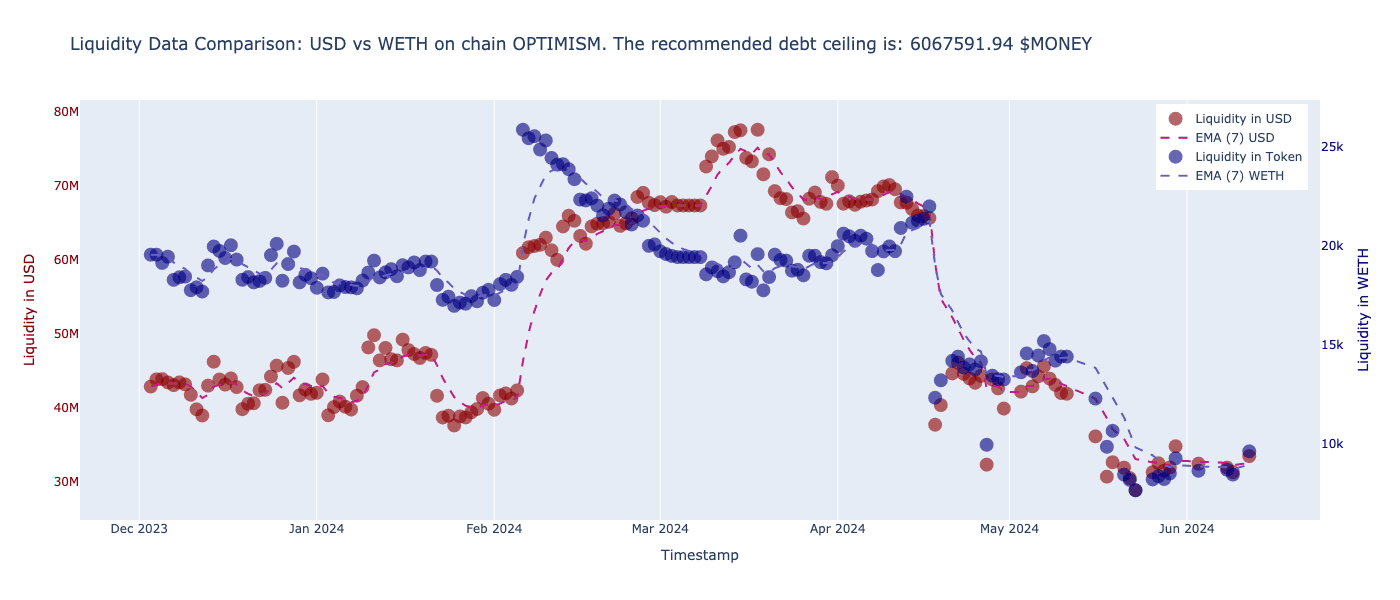
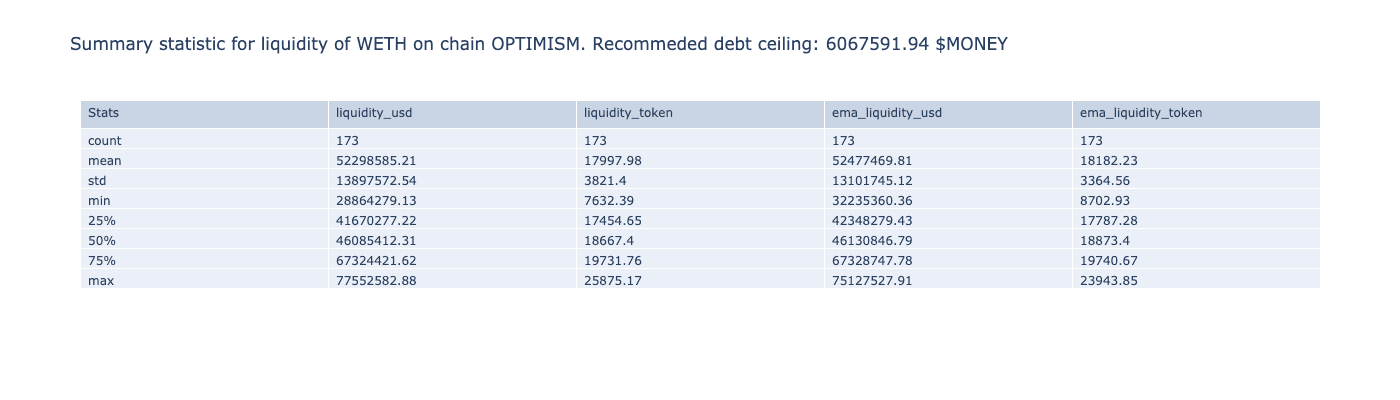
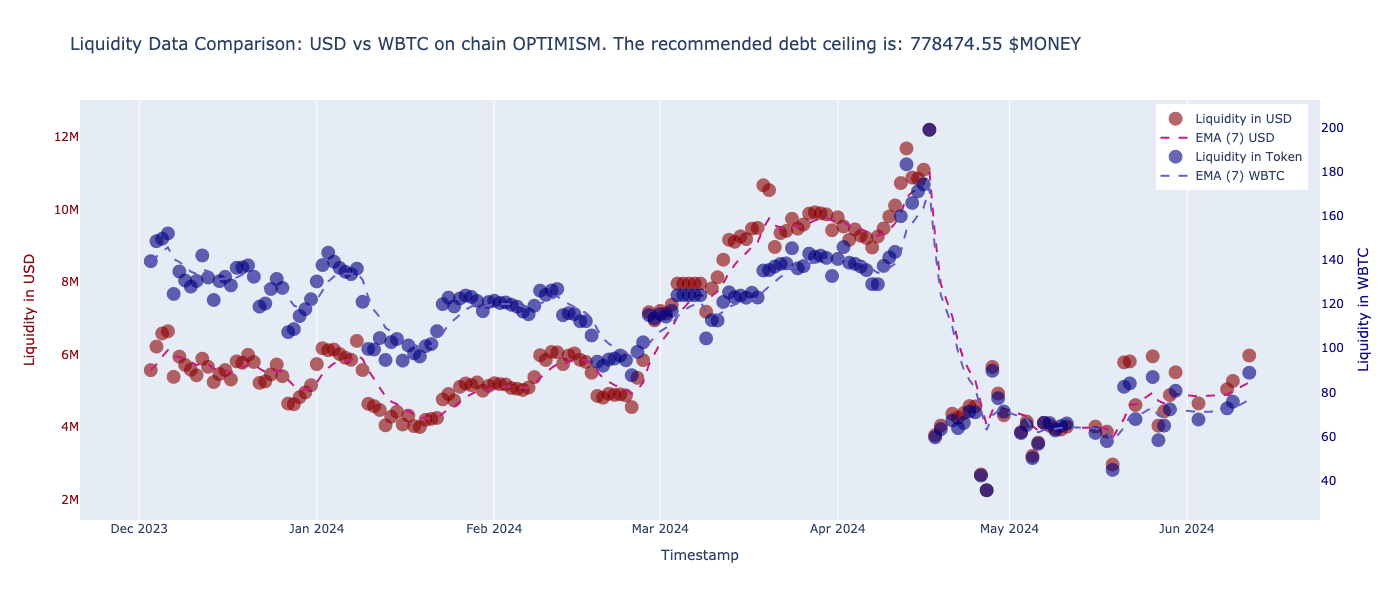
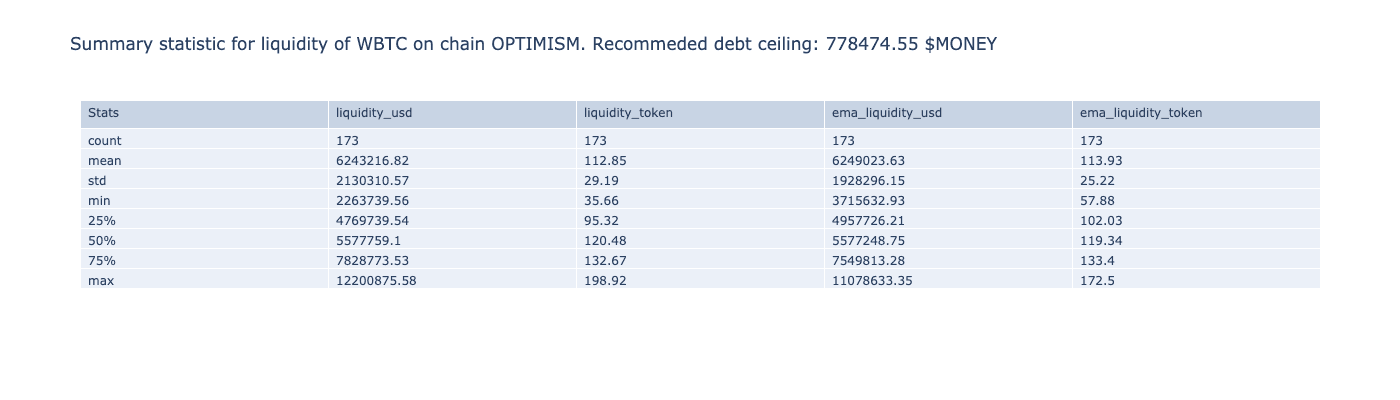
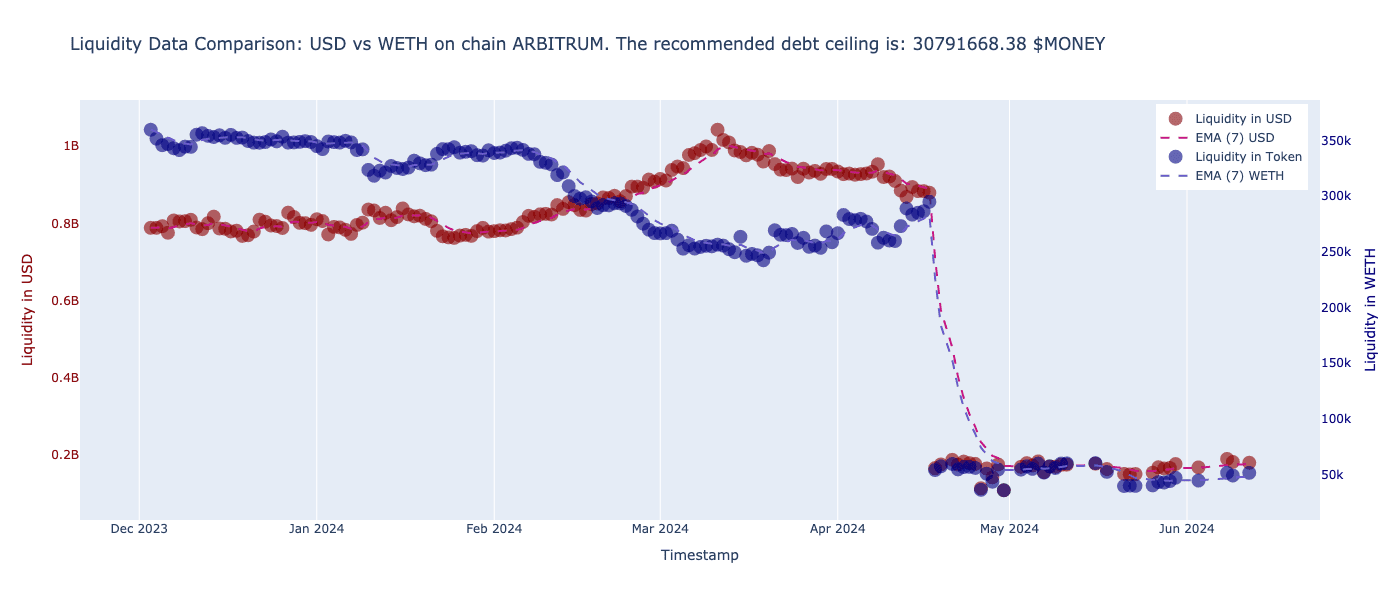
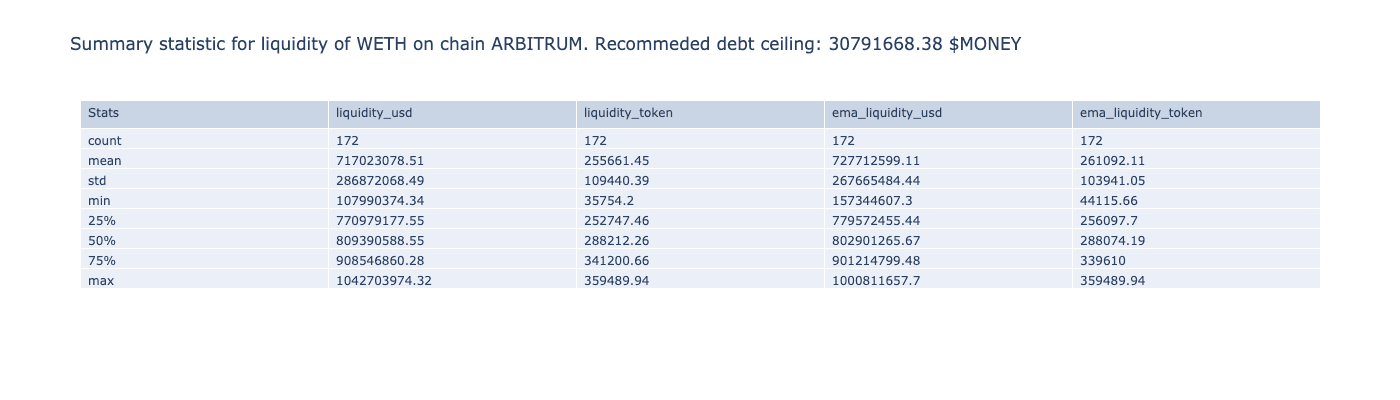
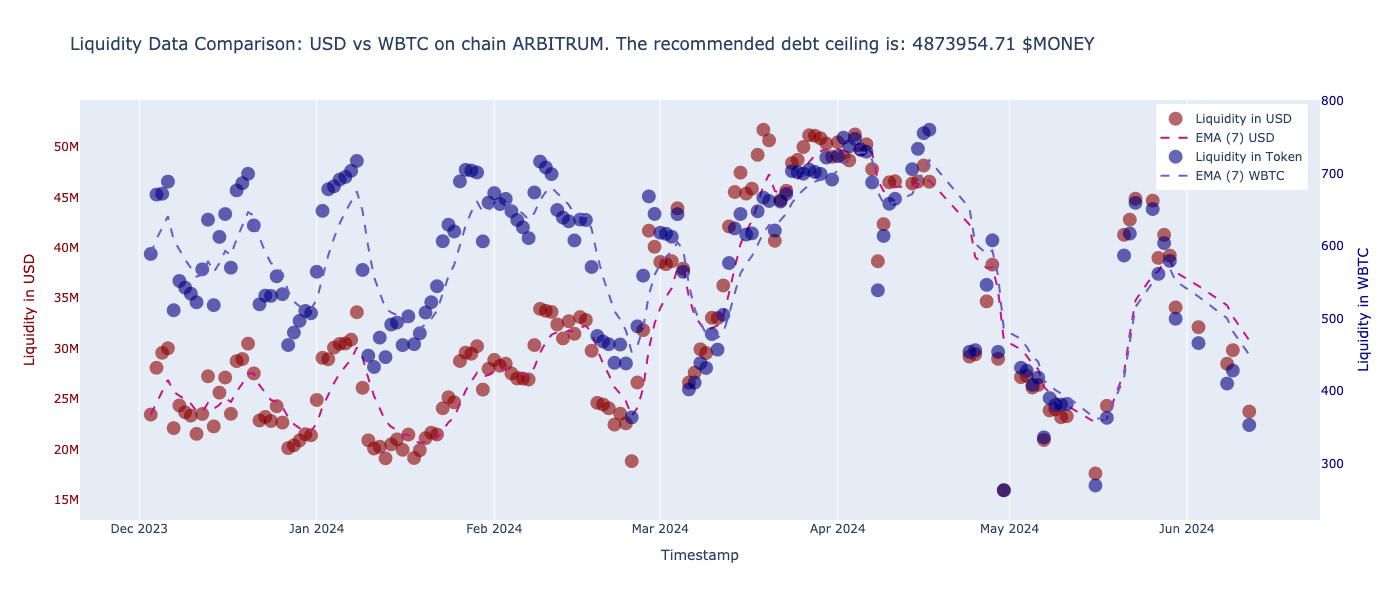
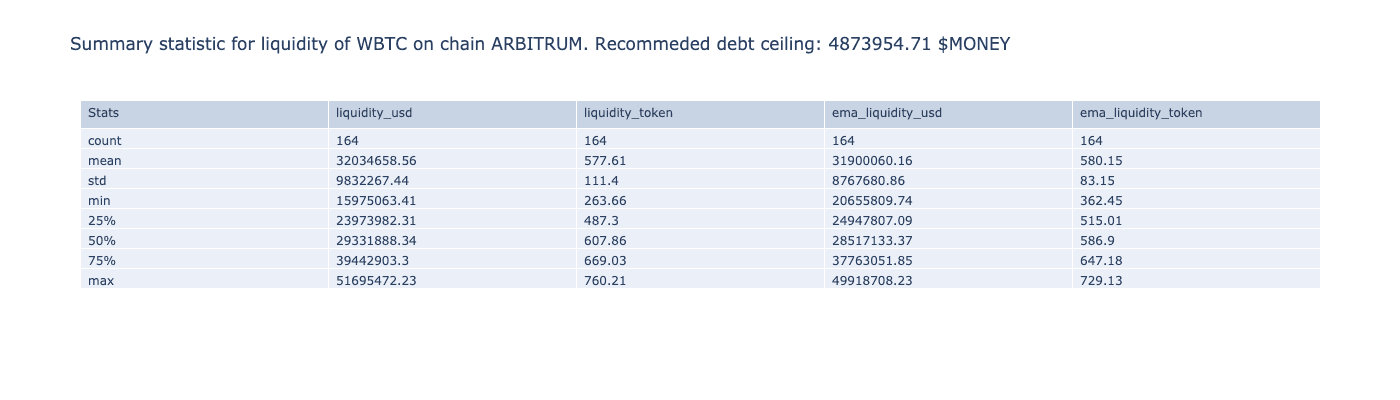
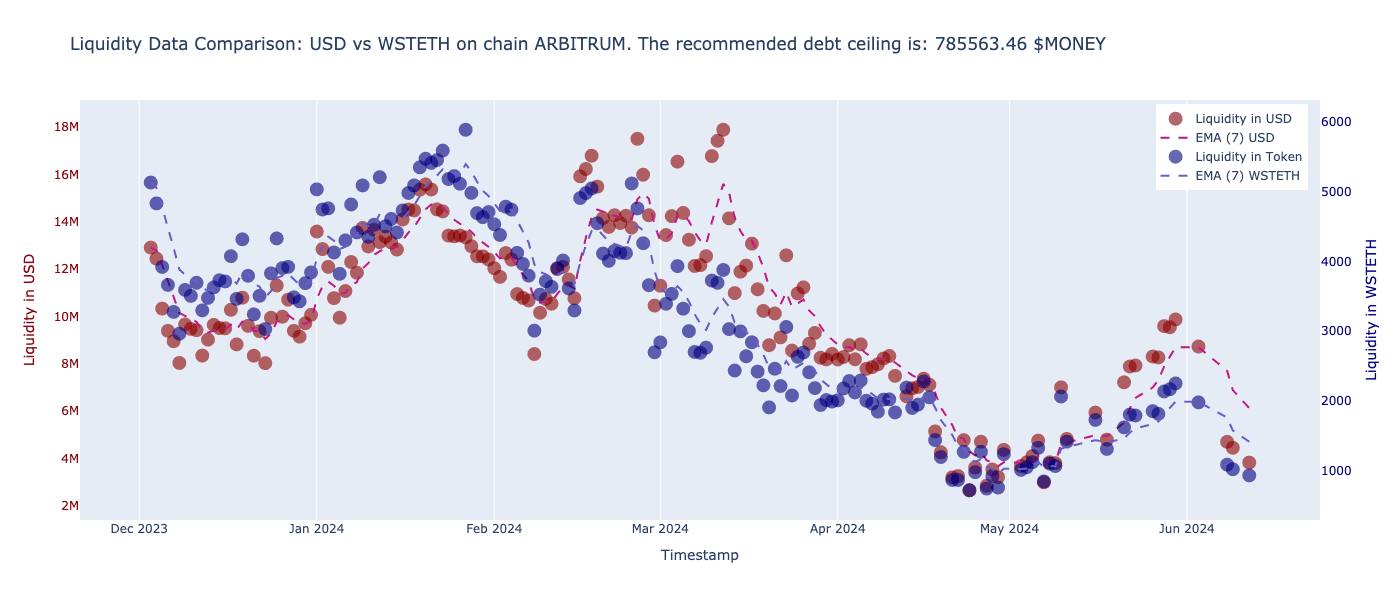
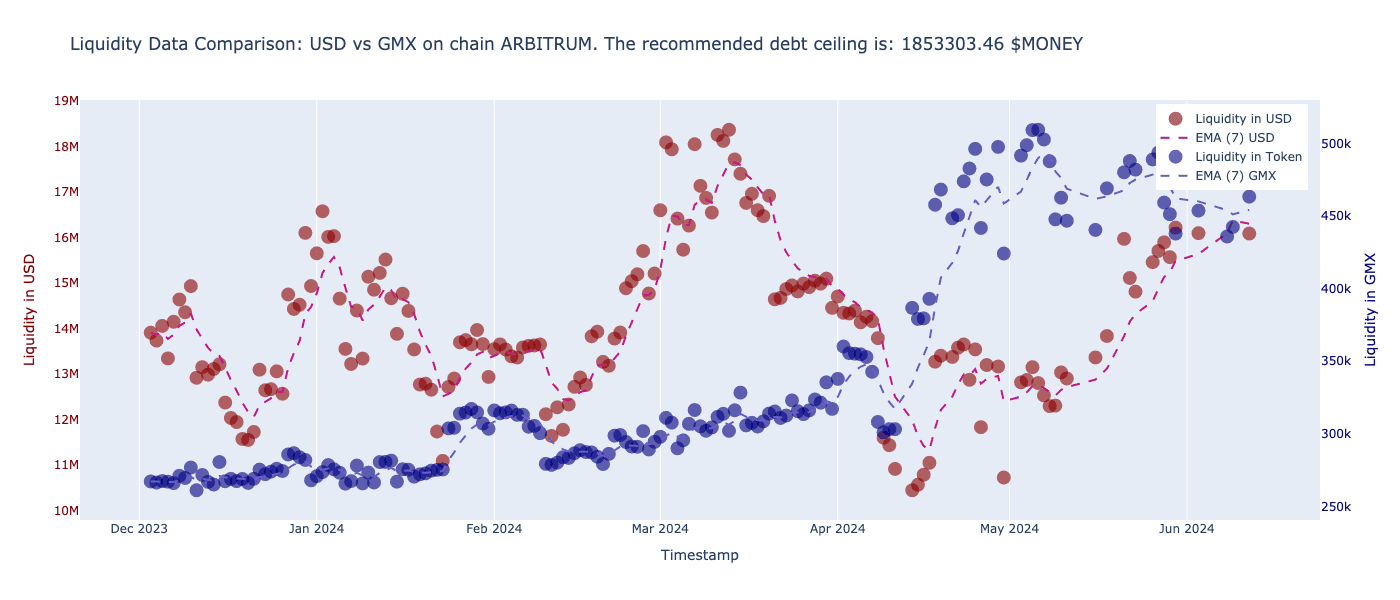
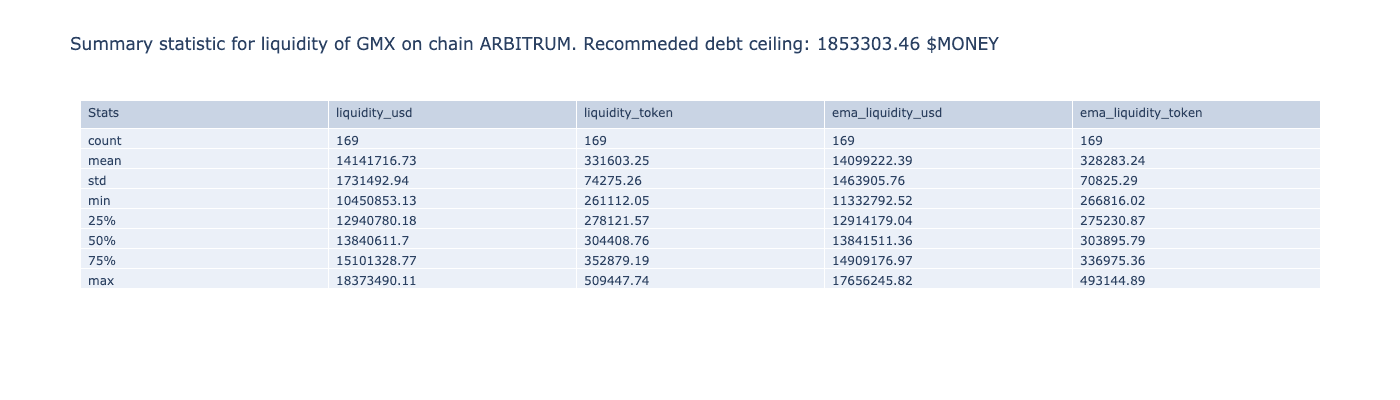
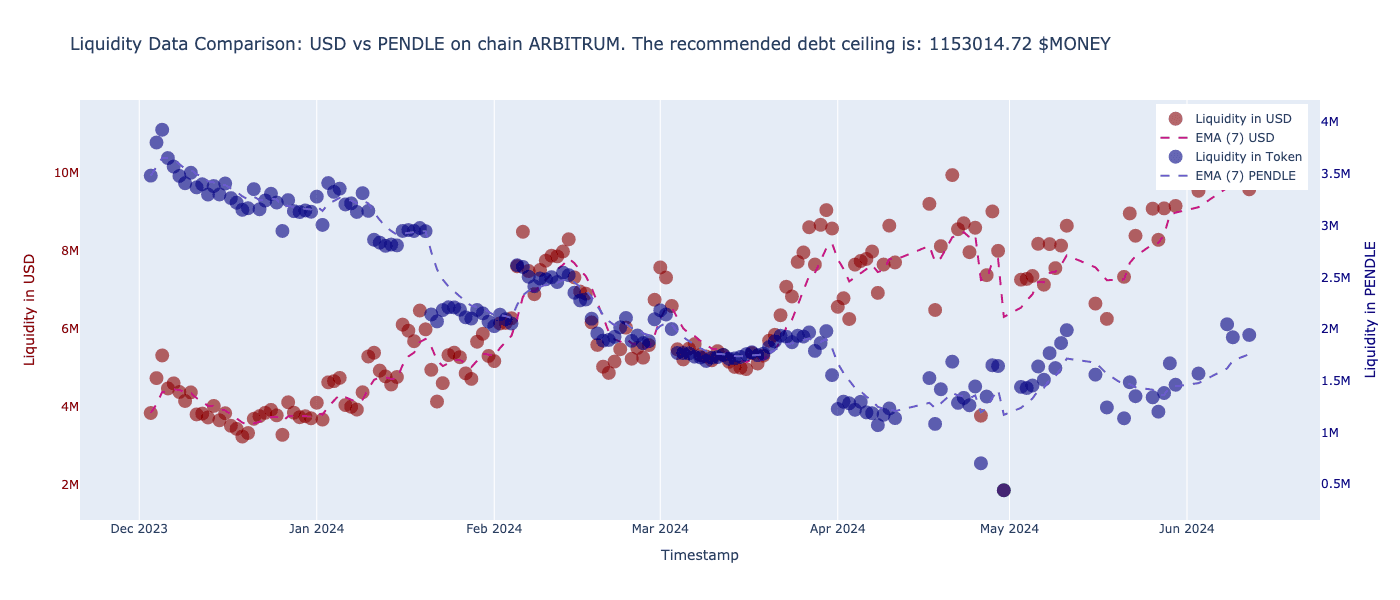
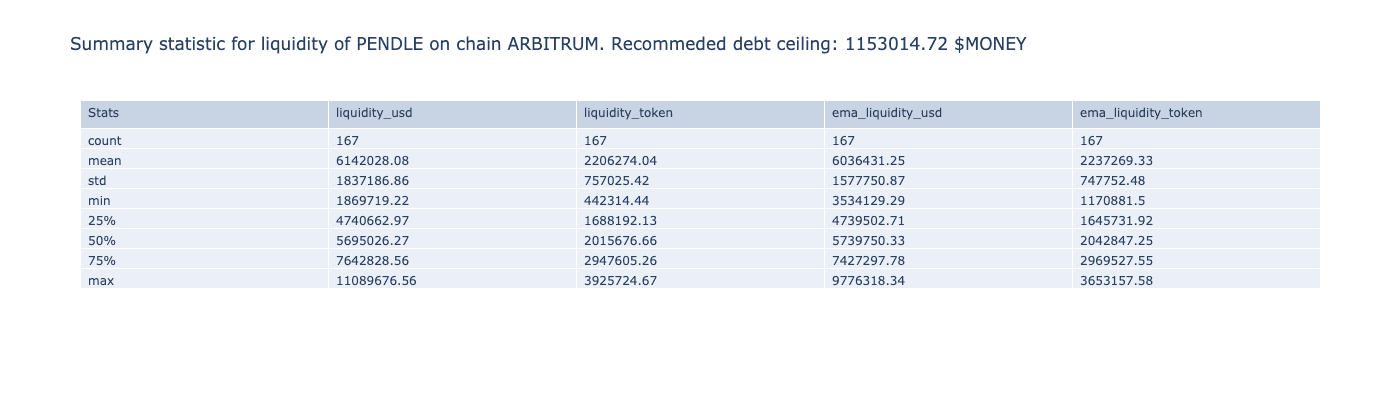
To define the debt ceiling for $MONEY markets, we leveraged the Dexguru API that aggregates liquidity across multiple pools. In cases where aggregated data was unavailable, we identified the most liquid pool. We collected 6 months of liquidity data for each asset, plotted it, and applied a 7-day Exponential Moving Average (EMA) to smooth short-term fluctuations and highlight trends. We identified the lowest liquidity point over the period and calculated 20% of the nominal token amount to determine the debt ceiling to ensure sufficient liquidity to facilitate orderly liquidations and arbitrage.
#1.2.3 Oracle Selection
Defi.money has a distinct challenge with establishing suitable oracles for its Layer-2 markets because, in many cases, there may exist a robust market for a particular asset on the respective chain, but liquidity is not sufficient on Curve to make use of the Curve EMA oracle. There may be suitable oracle alternatives such as Chainlink or Uni TWAP. The LLAMMA algorithm performs best with an oracle that is accurate to spot price, but which involves data-smoothing (hence a preference for the Curve EMA).
For the Oracle selection, we investigated several potential solutions benchmarked against CEX data. The rationale behind this methodology is to consider the CEX price as the proxy for market price. We selected for the proposed oracle approach which performed best against the benchmark. As oracles can involve several risks, including price manipulation and potential centralization vectors, it is imperative to select an oracle that balances performance and resiliency. This may introduce an element of subjectivity to Defi.money's decision on its oracle provider, as it must be considered acceptable to its community and stakeholders.
#1.3 Data Sources
Market and liquidity data for each proposed collateral was collected from the following sources:
(Asset | Name | Chain | Market | Params | Liquidity | Oracle)
-
$WETH Optimism Binance DexGuru RPC
-
$WBTC Optimism Binance DexGuru RPC
-
$wstETH Optimism Binance DexGuru RPC
-
$OP Optimism Binance DexGuru RPC
-
$VELO Optimism MEXC DexGuru RPC
-
$WETH Arbitrum Binance DexGuru RPC
-
$WBTC Arbitrum Binance DexGuru RPC
-
$wstETH Arbitrum Binance DexGuru RPC
-
$ARB Arbitrum Binance DexGuru RPC
-
$GMX Arbitrum Binance DexGuru RPC
-
$PENDLE Arbitrum Binance DexGuru RPC
-
$RDNT Arbitrum Binance DexGuru RPC
#Section 2: Markets Parameterization
The following section outlines the LLAMMAsimulator parameterization results for the proposed $MONEY markets:
-
ARB (500k sampling)
-
WBTC (500k sampling)
-
WETH (500k sampling)
-
GMX (100k sampling)
-
OP (100k sampling)
-
PENDLE (100k sampling)
-
RDNT (100k sampling)
-
VELO (100k sampling)
-
wstETH (100k sampling)
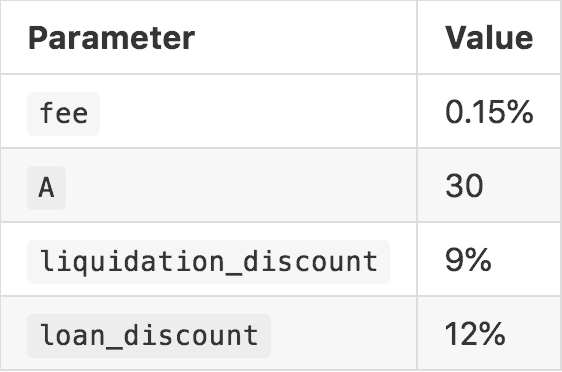
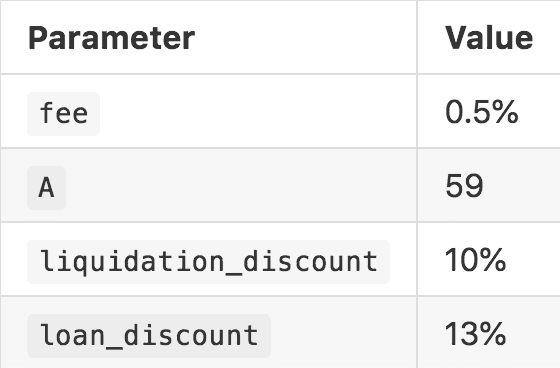
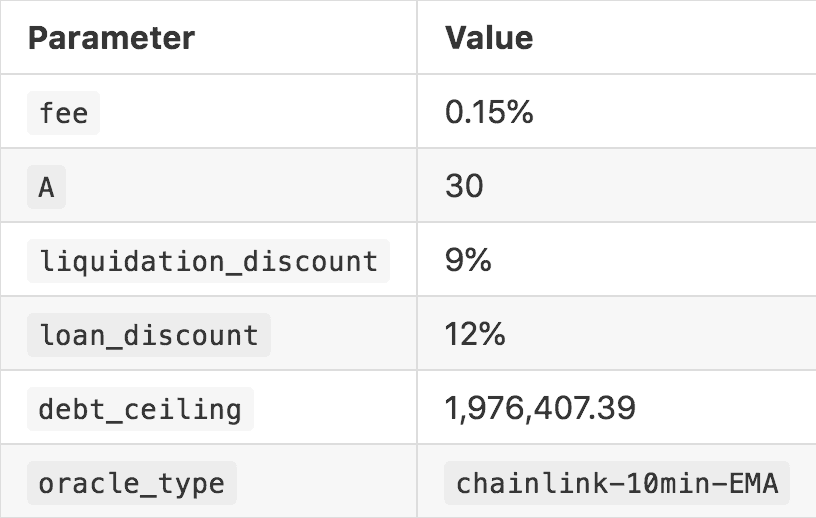
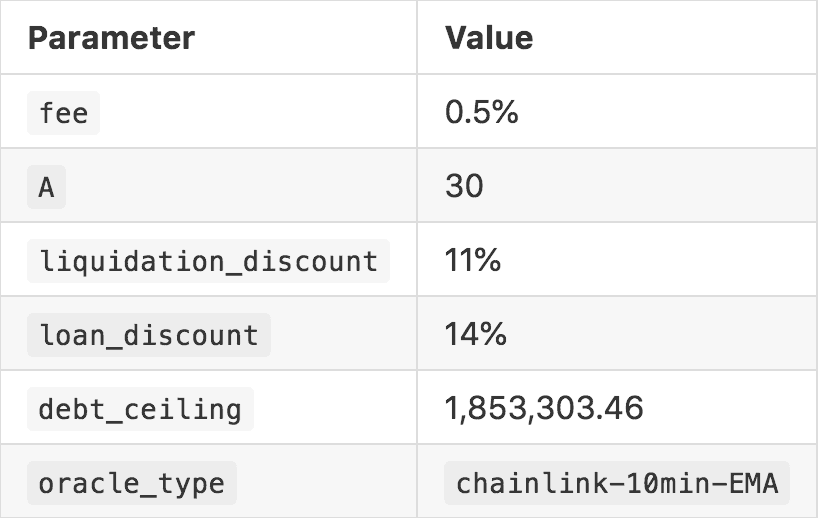
#2.1 ARB (500k sampling)
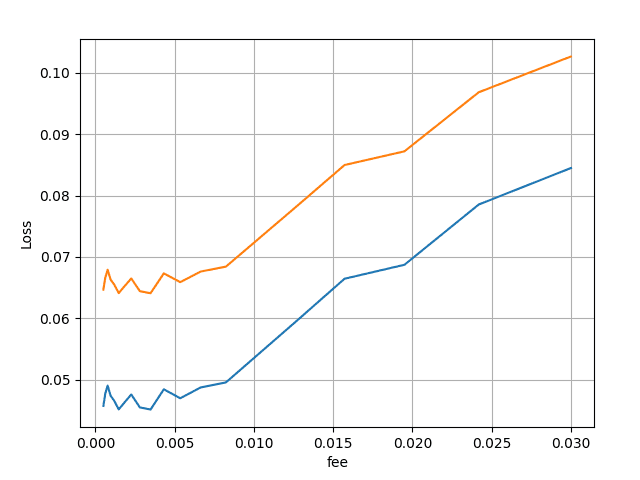
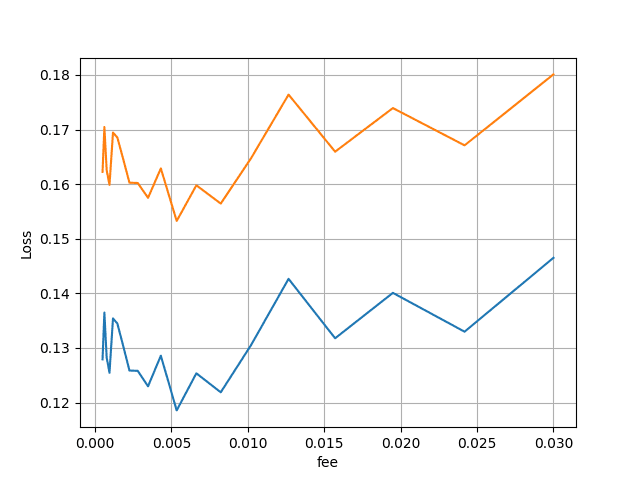
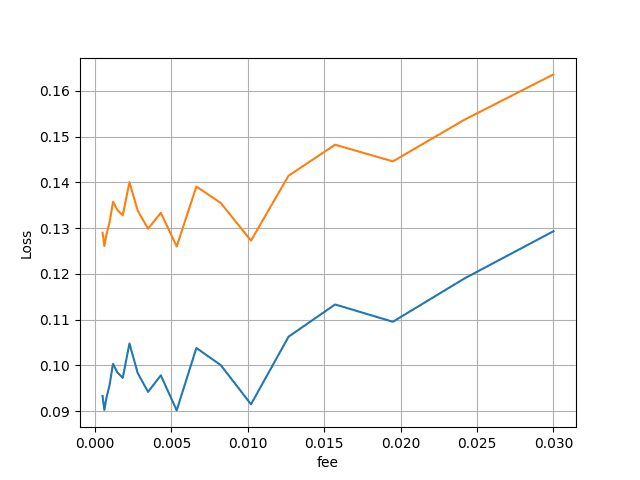
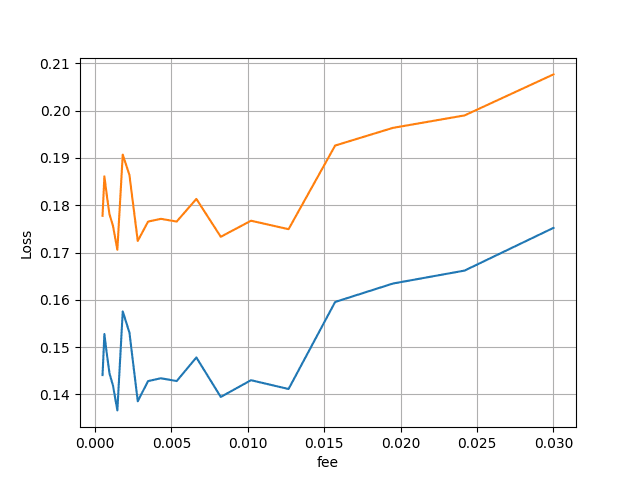
To determine the optimal fee, we calculated losses depending on the AMM fee for a 4-band position with A=50:
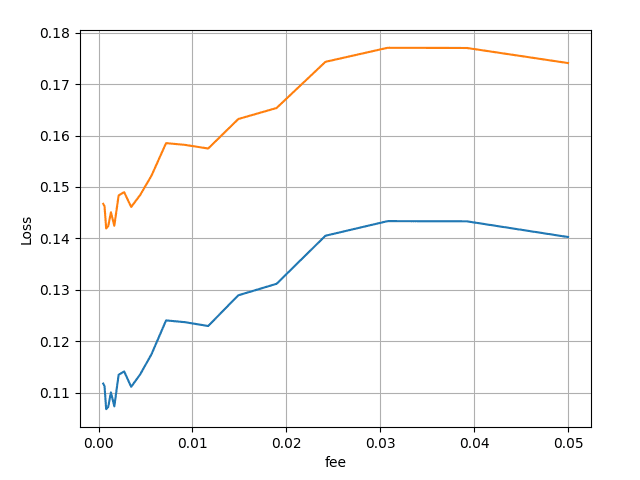
The graph suggests that the optimal fee is where the loss is at the minimum and is equal to approx. 0.15% (0.001318).
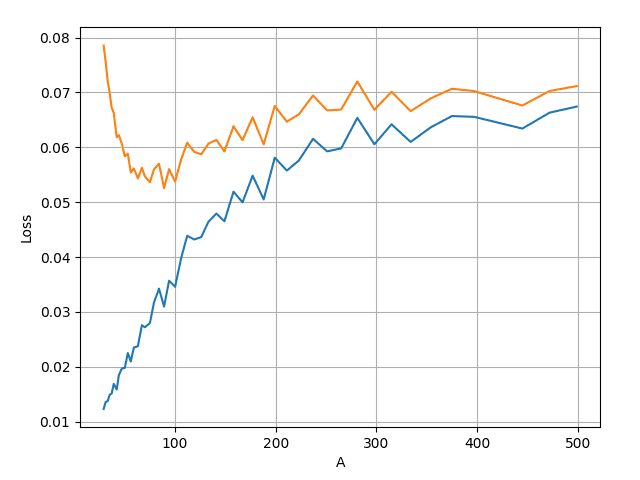
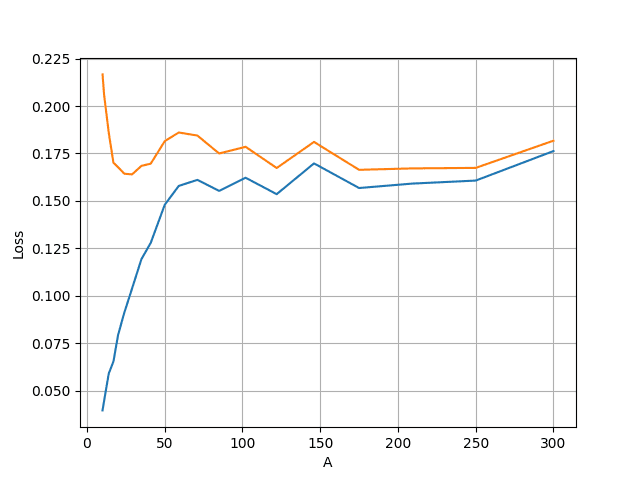
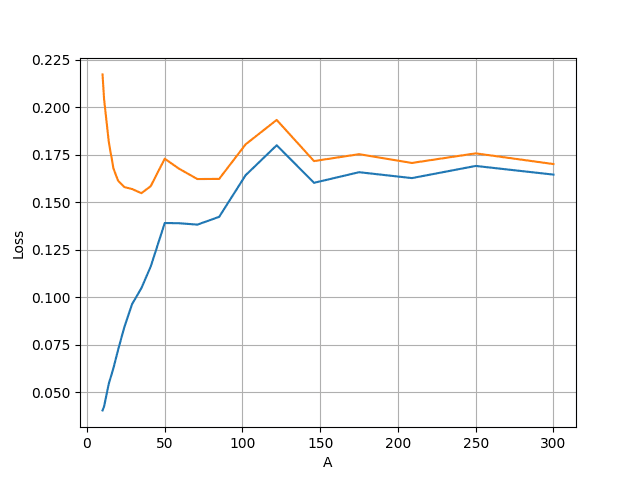
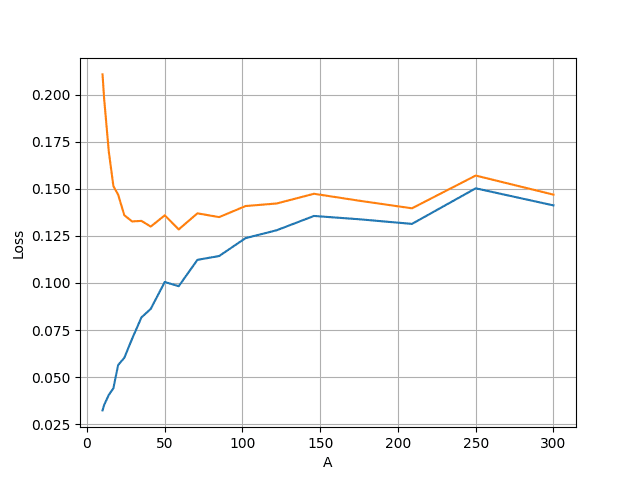
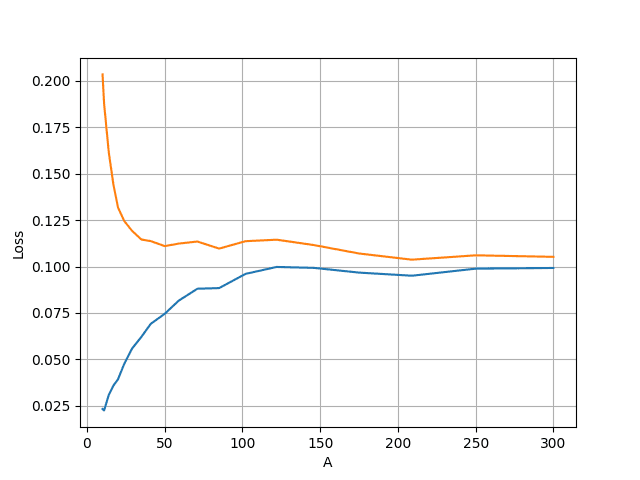
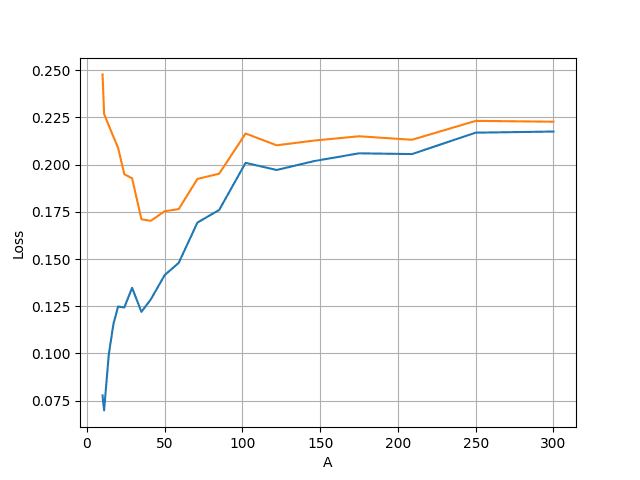
Given we have identified the optimal fee for the LLAMMA Market, we can now identify the optimal Amplification factor A, which depends on asset volatility. After simulating, we obtain two graphs - losses and discount:
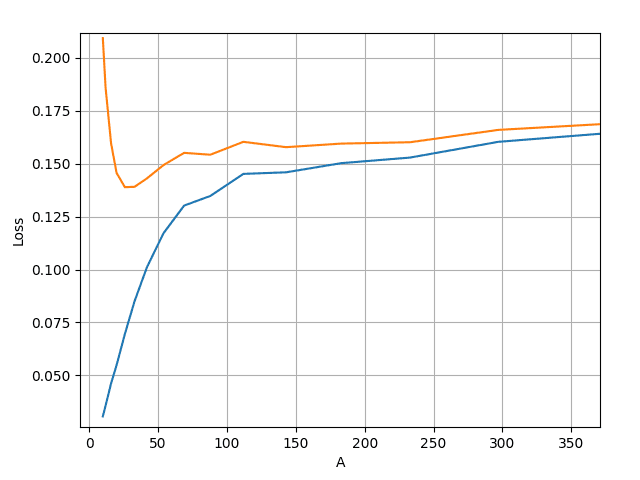
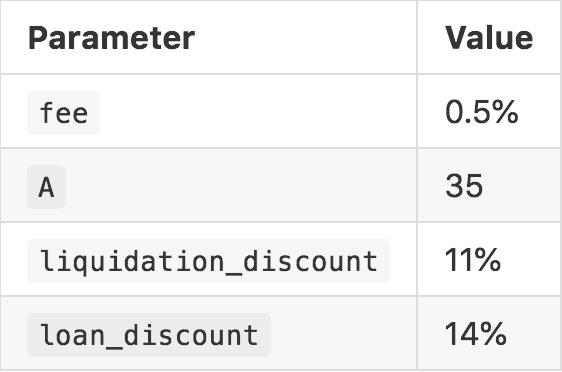
A is found by identifying the minimum of the Liquidity Discount (orange). Henceforth A = 30. To determine the liquidation_discount we identify the value of Loss (blue) at the A=30, meaning the liquidation_discount = 0.84. In order to prevent immediate liquidation, we add a 3% margin, meaning the loan_discount = 0.114.
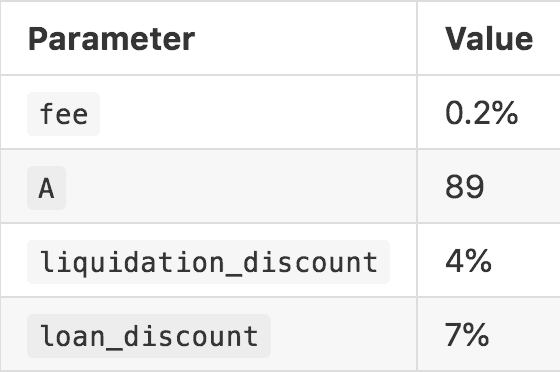
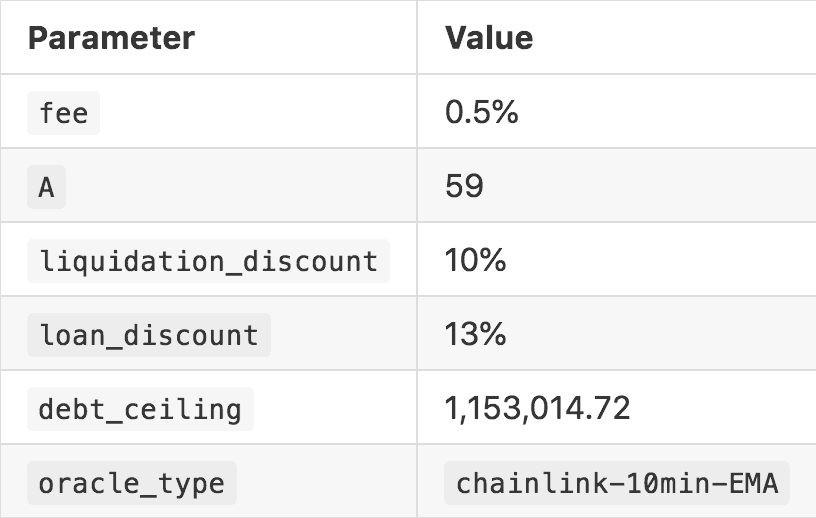
#2.2 WBTC (500k sampling)
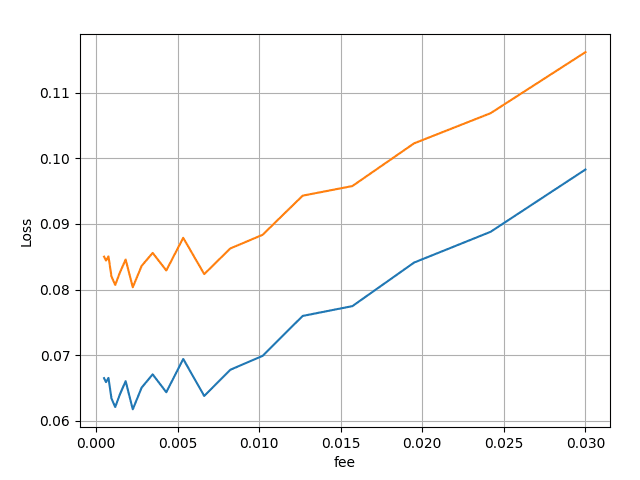
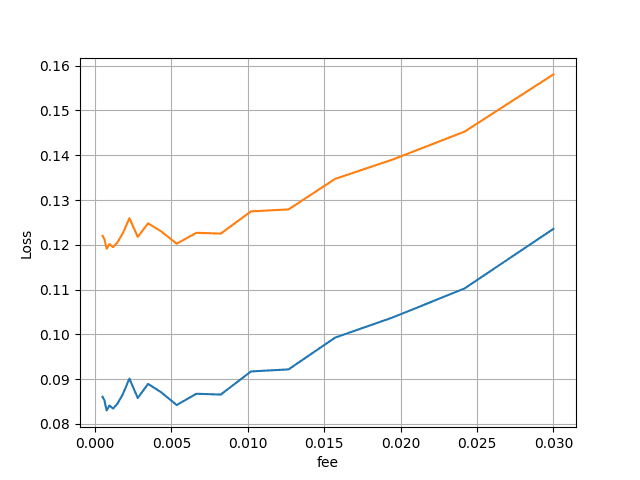
We calculate losses based on the AMM fee for a 4-band position with A=100, which results in the following graph:
The graph indicates that the optimal fee is approximately where the loss is minimized. A minor trade-off could involve using higher fees, equal to 0.00146860 and 0.00347738, hence we select 0.2%.
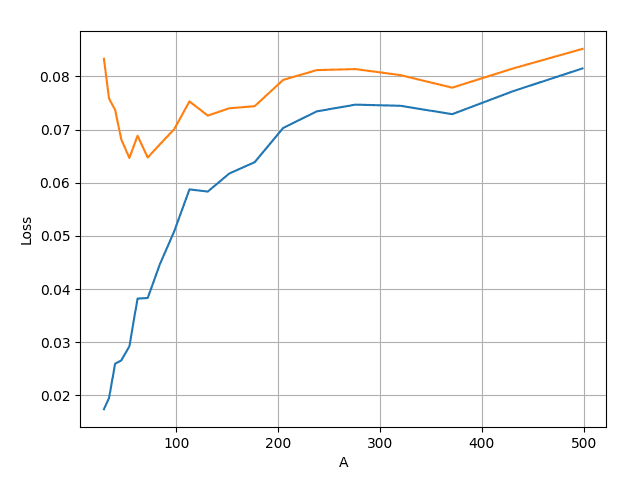
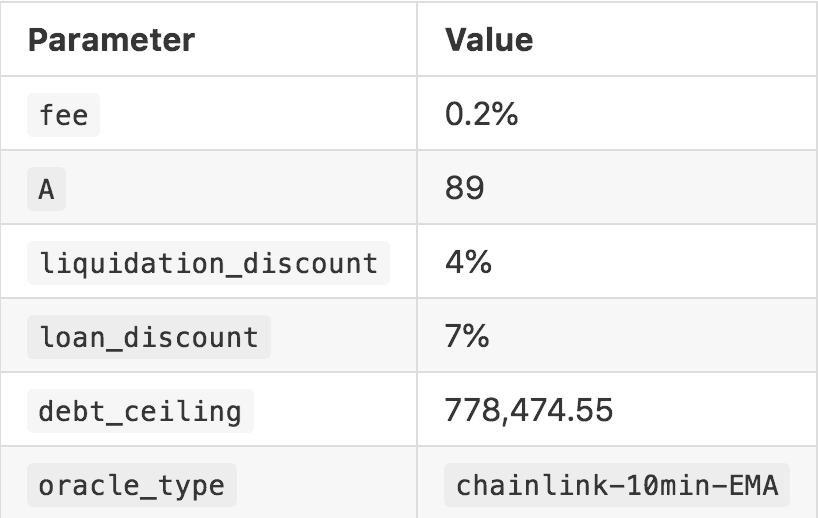
Having determined the optimal fee for the LLAMMA Market, we can now proceed to ascertain the true Amplification factor A, which is influenced by asset volatility. After running simulations, we generate two graphs for losses and discounts:
The optimal A is determined by locating the minimum point on the Liquidity Discount graph (orange). Consequently,A should be equal to 89. To calculate the liquidation_discount, we identify the value of the Loss graph (blue) at A = 89, which is liquidation_discount = 0.030971. To avoid immediate liquidation, we incorporate a 3% margin, resulting in a loan_discount = 0.060971. To be conservative we round final values up.
Note: The WBTC<>crvUSD market has been deployed with the following parameters:
-
_A_=100, -
_fee_=0.19, -
_liquidation_discount_= 6% and -
_loan_discount_= 9%.
The WBTC<>crvUSD LLammaLend market has:
-
_A_=75, -
_fee_=0.15, -
_liquidation_discount_= 3.5% and -
_loan_discount_= 6.5%
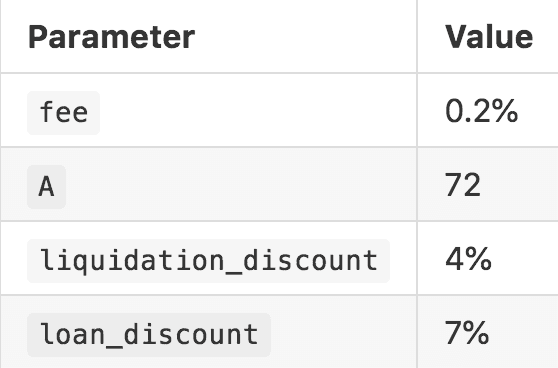
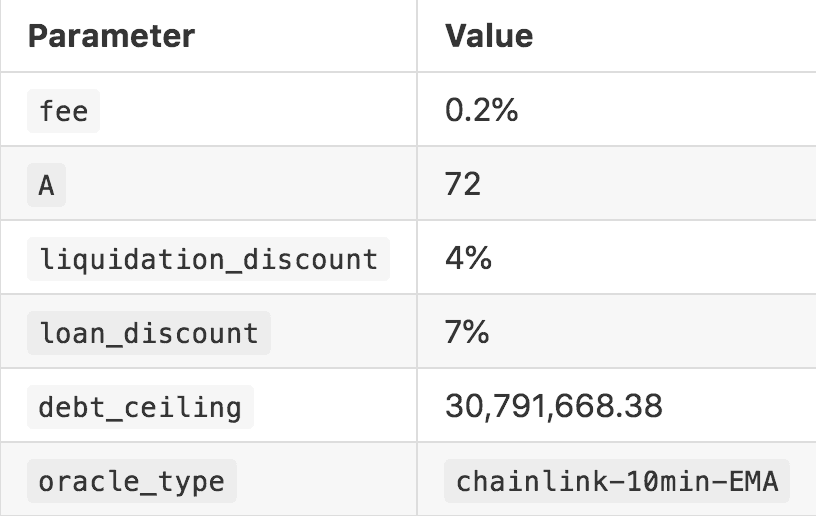
#2.3 WETH (500k sampling)
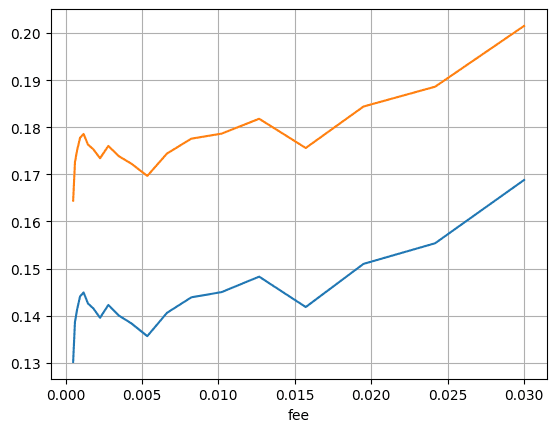
Losses are calculated based on the AMM fee for a 4-band position with A=100, as illustrated in the graph below:
The graph reveals that the lowest losses correspond to an AMM fee at 0.2%.
Upon establishing the optimal fee for the WETH, we next focus on the Amplification factor A. The simulations yield the following results for losses and discounts:
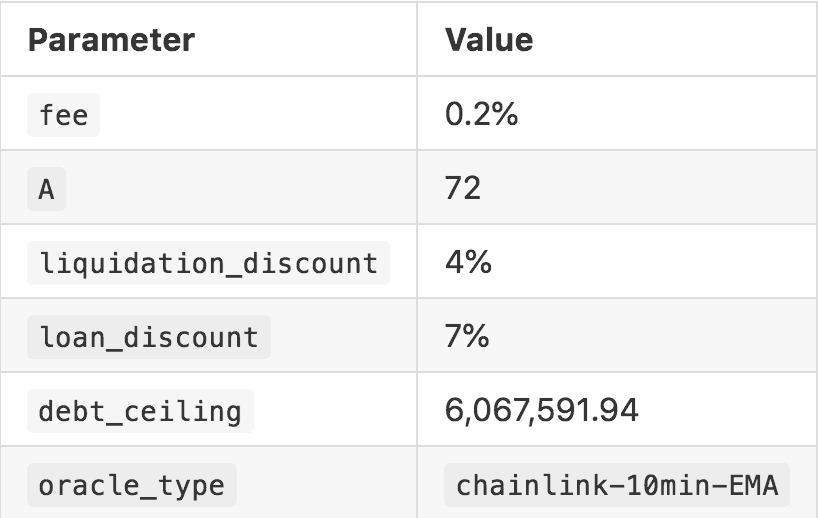
From these findings, the optimal Amplification factor A is either 54 or 72. To maximise the LTV we settle on 72. The derived parameters, based on the loss behavior and market dynamics, are as follows:
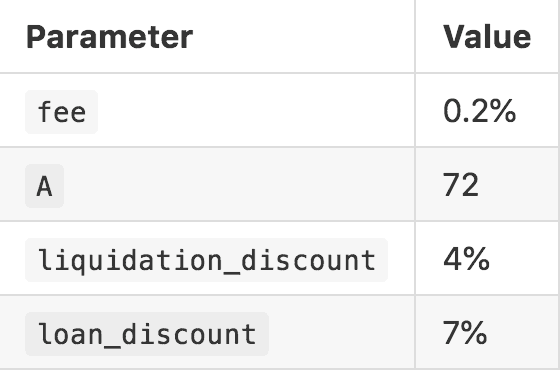
The liquidation_discount of 4% provides a buffer against rapid market movements that could lead to loss scenarios, while a loan_discount of 7% offers an additional margin to safeguard against immediate liquidations.
Note: The crvUSD<>WETH market has been deployed with the following parameters:
-
_A_=100, -
_fee_=0.19, -
_liquidation_discount_= 6% and -
_loan_discount_= 9%.
crvUSD<>WETH LlammaLend market :
-
_A_=70, -
_fee_=0.6, -
_liquidation_discount_= 4% and -
_loan_discount_= 7%.
#2.4 GMX (100k sampling)
For the GMX asset, we have computed losses based on the AMM fee for a position featuring an Amplification factor of A=50 across a range of fees:
The optimal fee is identified as approximately 0.5%.
Further detailed simulations help refine our understanding of the market behavior and the ideal parameterization for the $GMX market:
The critical point for minimizing the Liquidity Discount, marked ~0.16398, establishes A = 29 as the optimal Amplification factor. While there are multiple additional possible values of A, the Loss (blue) also increases meaning the Max LTV worsens. Hence, the corresponding losses for an A of 29 are approximately at ~0.10389.
Hence, the parameters extracted from these findings for the $GMX market are given as follows:

#2.5 OP (100k sampling)
In the analysis for the OP asset, we assessed the losses in relation to the AMM fee for a configuration with an Amplification factor of A=50. The resulting graph illustrates the point where losses are minimized, indicating the optimal fee strategy:
The optimal fee is calculated at approximately 0.5% or 0.005351.
Further investigations and simulations provided additional insights, which helped pinpoint the best parameters for managing market exposure and liquidity:
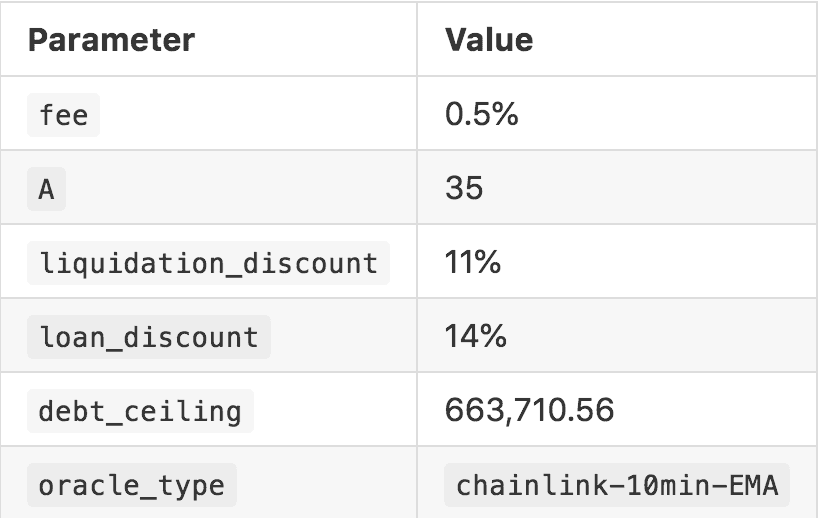
From this graph, we extract the key metrics where the Liquidity Discount reaches at ~0.154879, thereby suggesting an A = 35 as the optimal Amplification factor with a loan_discount of ~0.104906.
Based on these insights, the operational parameters for the $OP market are structured as follows:
#2.6 PENDLE (100k sampling)
For the PENDLE, loss calculations based on the AMM fee were performed for an Amplification factor of A=50. The following graph visualizes where losses are minimized, identifying the most effective fee:
Here, the optimal fee is identified as approximately 0.5% or 0.005351, aimed at optimizing loss mitigation within this market setting.
Following these findings, further simulations yield a detailed graph, pinpointing optimal market parameters:
This graph shows that Liquidity Discount is minimized ~0.128435, establishing A = 60 as the optimal Amplification factor. The loan discount derived from losses is ~0.09828
The parameters for the $PENDLE market, informed by these simulations, are laid out as follows:
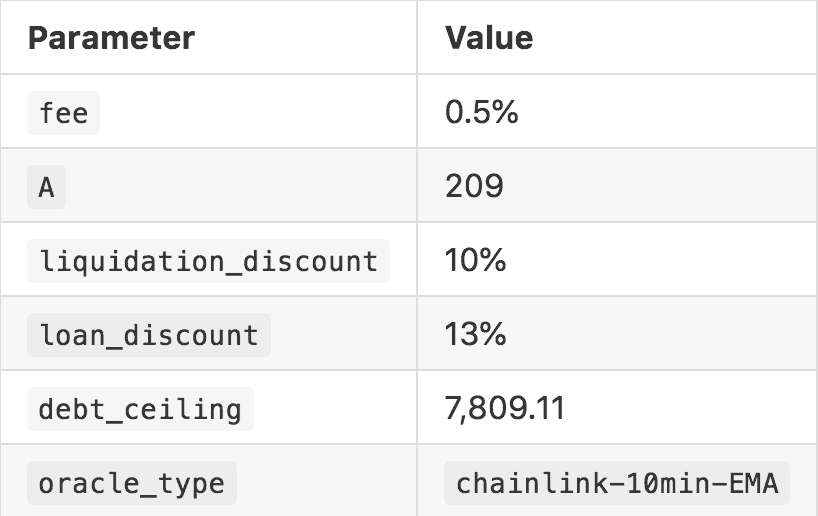
#2.7 RDNT (100k sampling)
In our analysis of the RDNT, losses were assessed in relation to the AMM fee for a configuration featuring an Amplification factor of A=50. The resultant graph below identifies the optimal point for minimizing losses while considering fee profitability:
The chosen optimal fee is approximately 0.1% or 0.000769. Further detailed analysis through simulations yielded another graph, providing insights into the optimal parameters for managing the market's volatility and liquidity:
This graph indicates critical points for minimizing Liquidity Discount ~0.11694, setting A = 250 as the optimal Amplification factor. The liquidation discount is identified based on the corresponding losses at ~0.11694.
The operational parameters for the $RDNT market are structured as follows:
Note: Overall, RDNT simulation shows questionable parameter recommendation due to the high A and we suggest delay of this market into the future after a more comprehensive simulation framework has been developed.
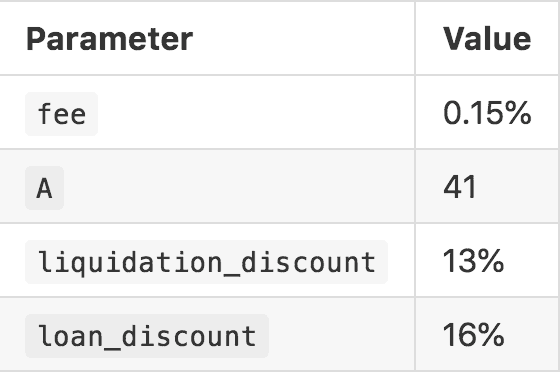
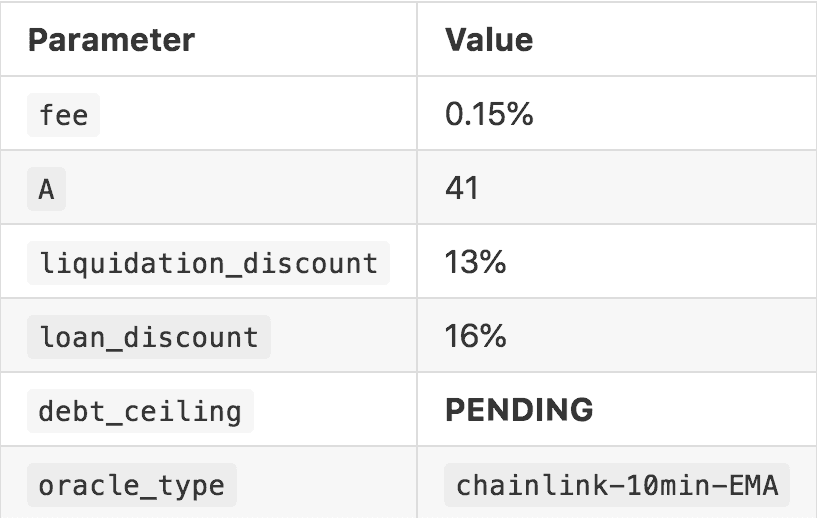
#2.8 VELO (100k sampling)
Similar to prior markets, we set the amplification to 50 to identify the optimal fee parameter. The loss is minimized at Loss of ~0.136620, suggesting an optimal fee of 0.001469 or ~0.15%.
Given we identified the optimal fee we now turn to identifying the application factor with the corresponding market parameter. The simulation suggests that Liquidation Discount (orange) is minimized at ~ 0.170254. This suggests an A of 41. The corresponding losses equate to ~0.128581.
Therefore, the operational parameters for the $VELO market seem to be:
#2.9 wstETH (Historical Analogy)
For $wstETH we default to the same parameter as the WETH market deployment, as they fundamentally share the same underlying asset and the price dynamics should follow the same price action. This assumption is consistent with the wstETH market implemented on crvUSD. Therefore the recommended parameters are:
Note: The crvUSD market has been deployed with the following parameters:
-
_A_=100, -
_fee_=0.19, -
_liquidation_discount_= 6% and -
_loan_discount_= 9%.
crvUSD<>wstETH LlammaLend market:
-
_A_=70, -
_fee_=0.6, -
_liquidation_discount_= 4% and -
_loan_discount_= 7%.
#Section 3: Debt Ceiling
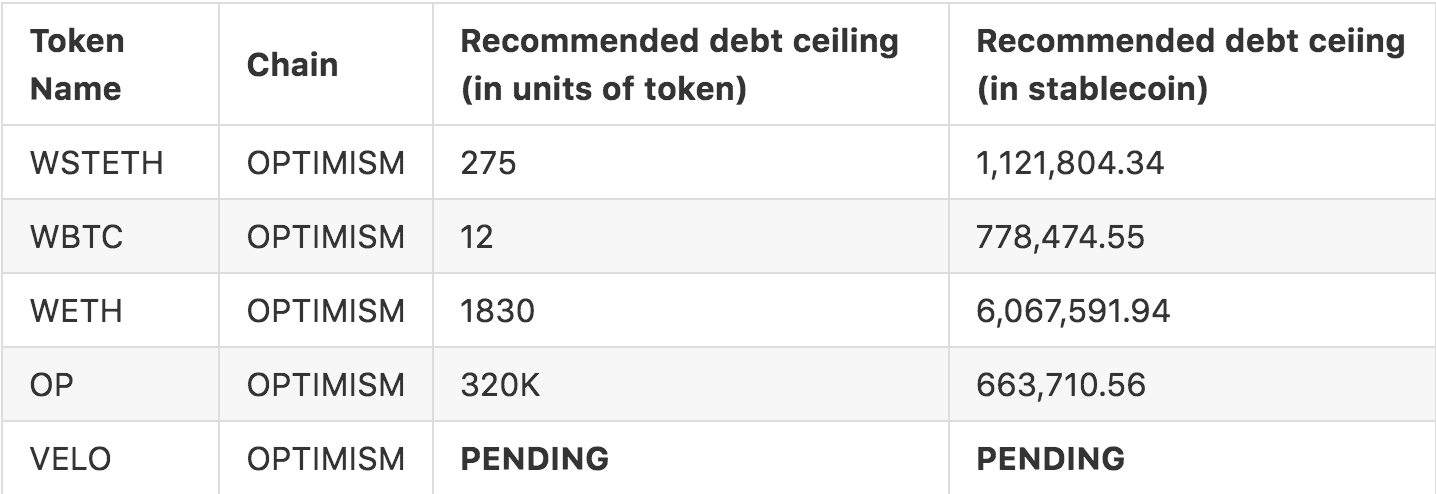
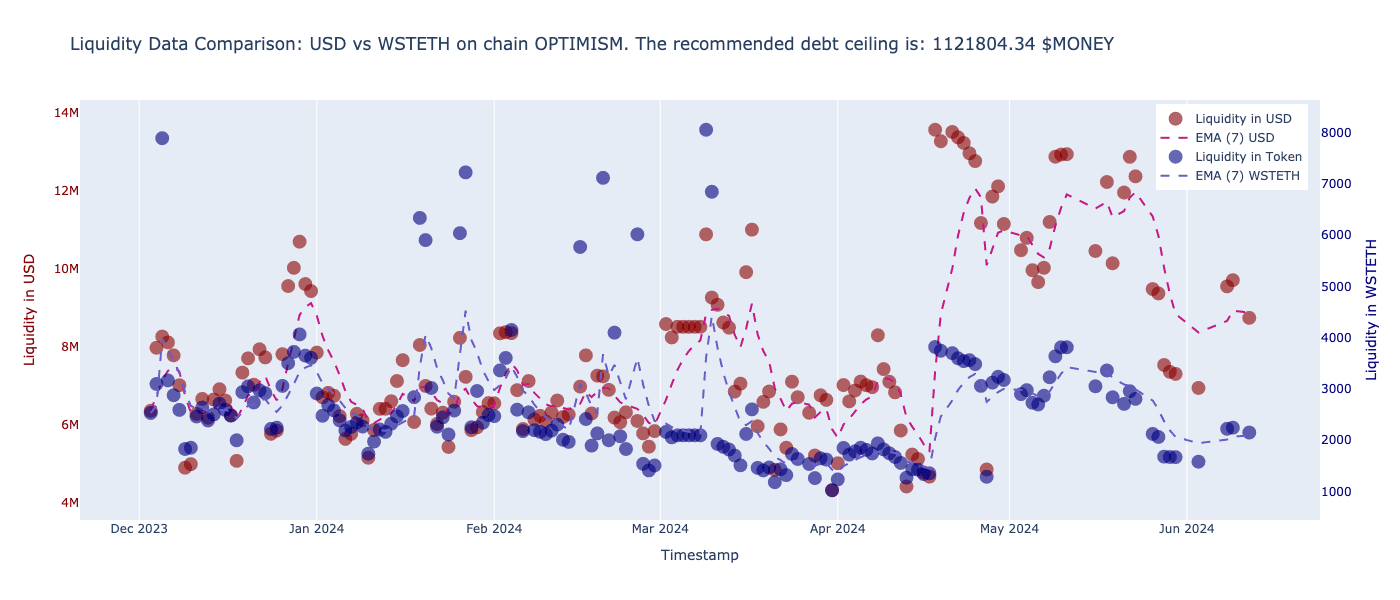
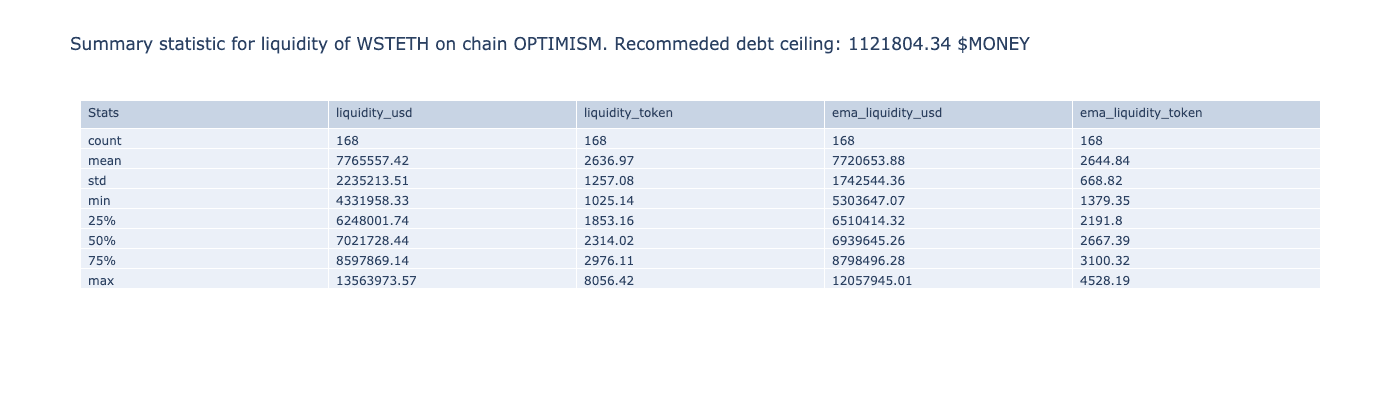
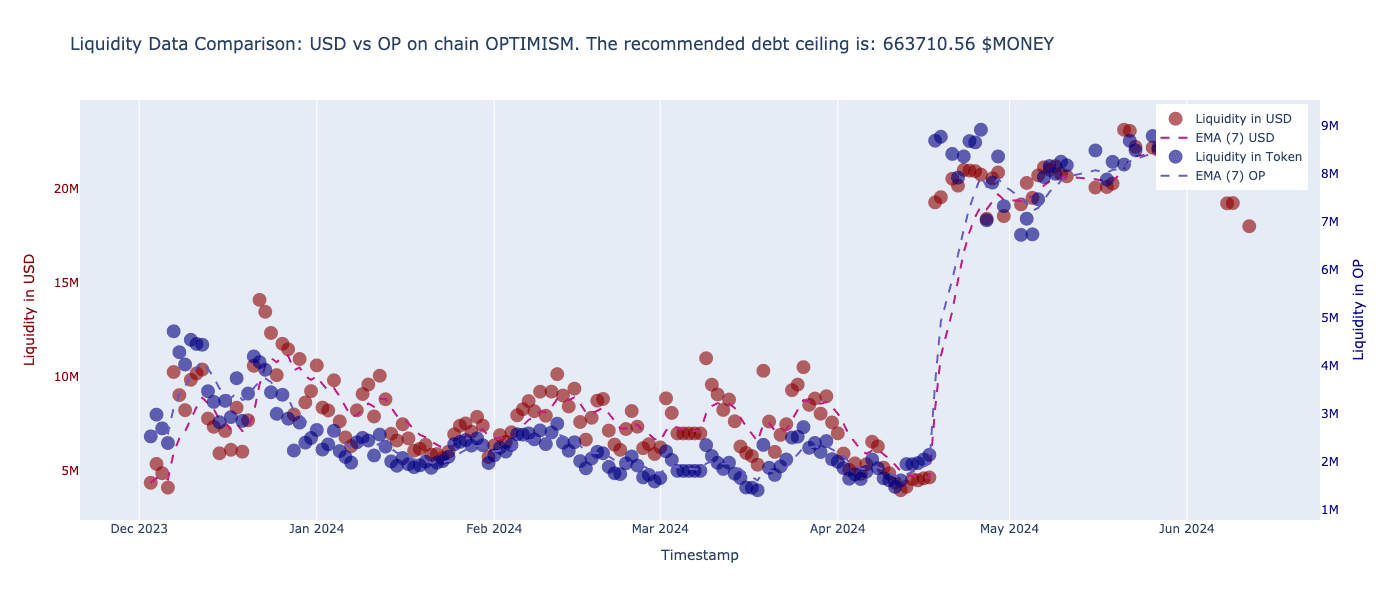
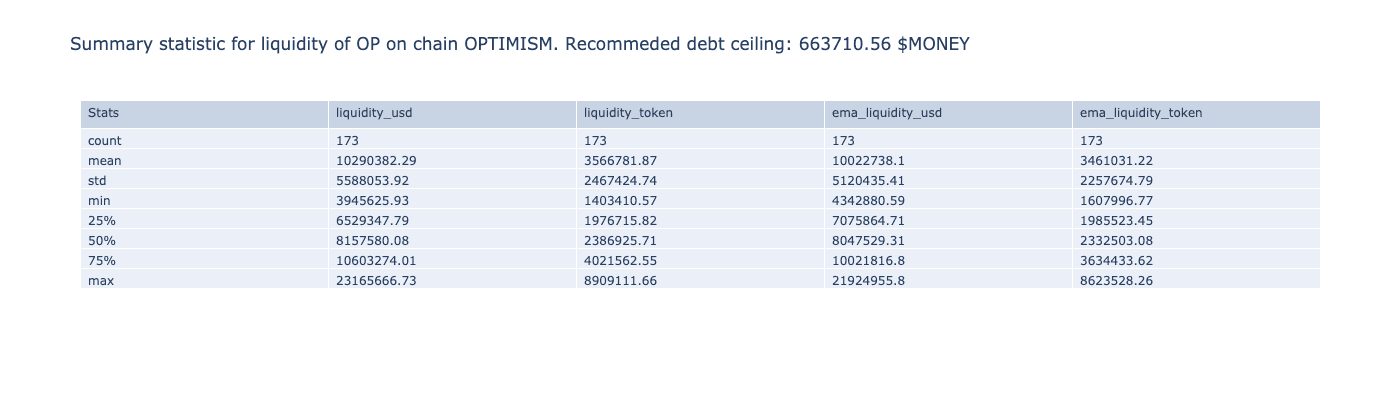
We analyze the market's liquidity of the considered tokens over a period of 6 months. Liquidity of a token is defined as the total value, denominated in dollars, of assets one can swap the token for. We fit a 7-day exponential moving average to the liquidity data and define the debt ceiling to be 20% of the minimum of the liquidity EMA over the considered period.
In the analysis, we make the assumption that liquidations/arbitrage are executed atomically using flash loans, disregarding the possibility of bridging. So for example, we disregard the liquidity of the tokens on the other chains as well as the possibility of unwrapping wstETH. This gives the most conservative value for these markets, which may be a useful starting point for alpha launch of the protocol.
Our results are summarized in the following section.
#3.1 Results summary:
#3.1.1 Recommended debt ceiling for collateral tokens on Optimism
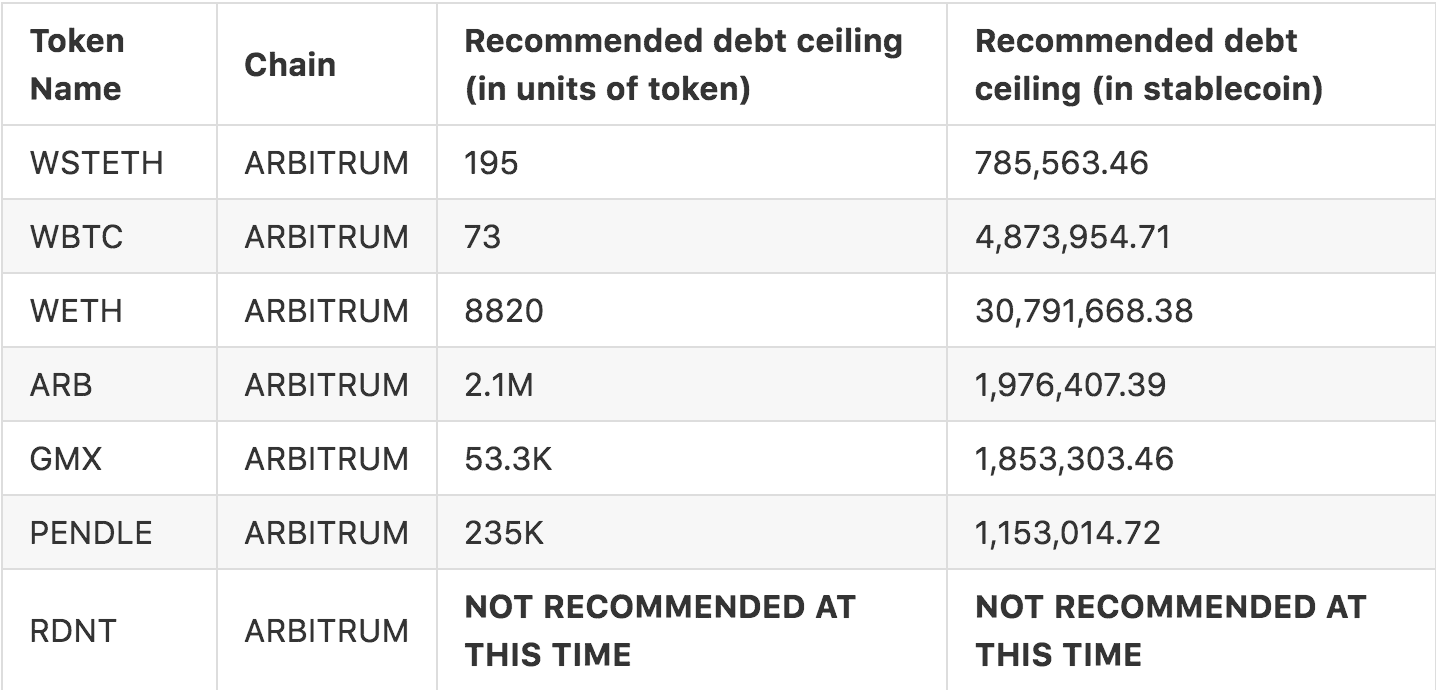
#3.1.2 Recommended debt ceiling for collateral tokens on Arbitrum
#3.2 Analysis
#3.2.1 WETH ON OPTIMISM
#3.2.2 WBTC ON OPTIMISM
#3.2.3 WSTETH ON OPTIMISM
#3.2.4 OP ON OPTIMISM
#3.2.5 WETH ON ARBITRUM
#3.2.6 WBTC ON ARBITRUM
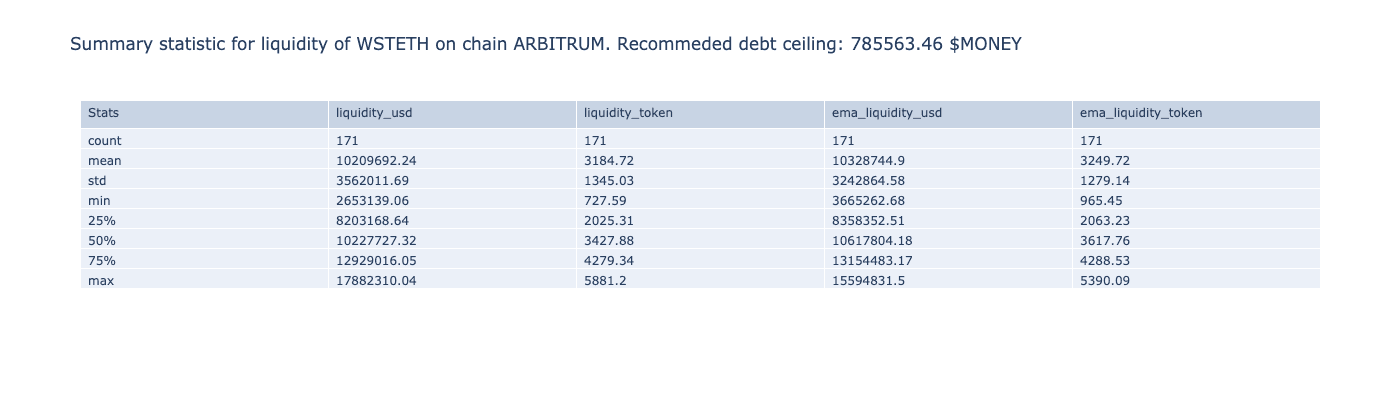
#3.2.7 WSTETH ON ARBITRUM
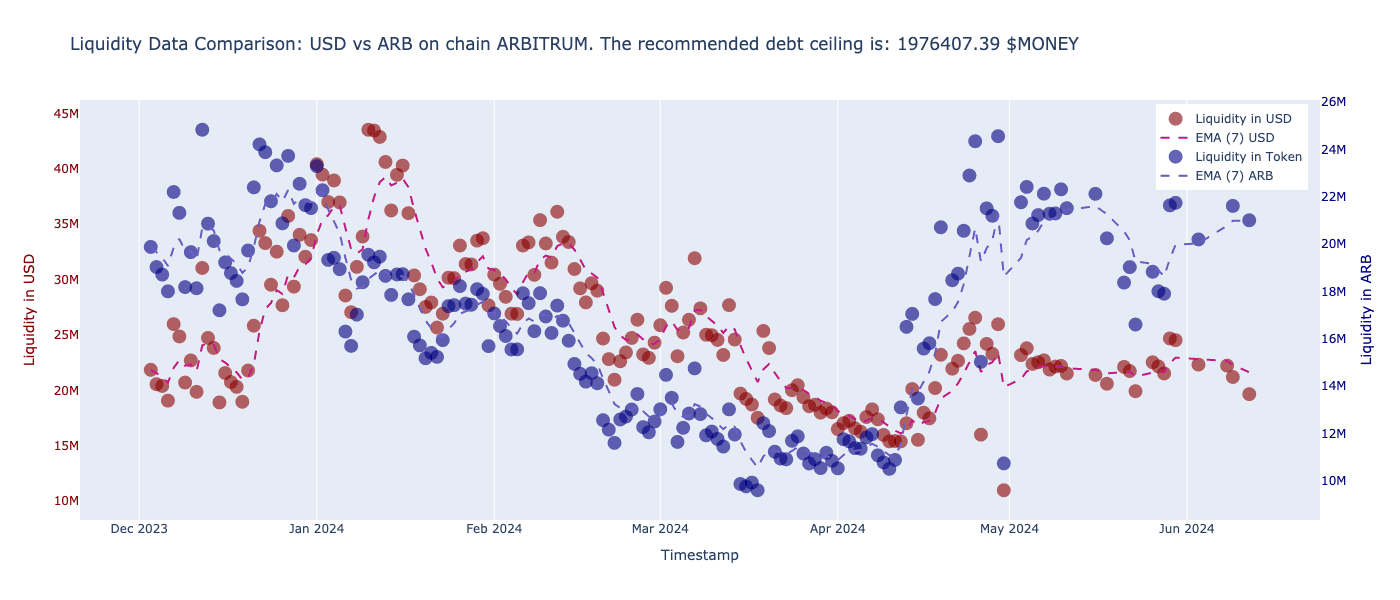
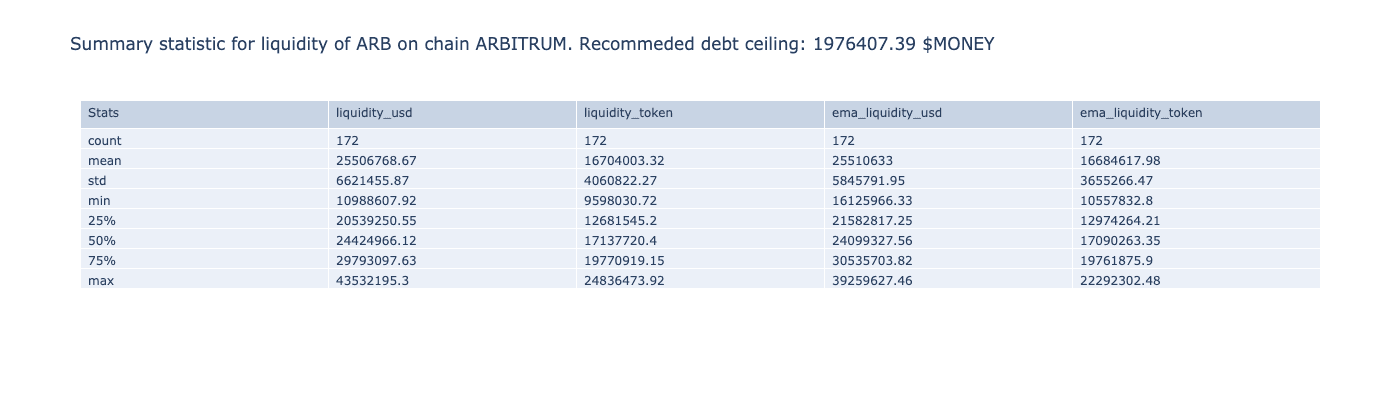
#3.2.8 ARB ON ARBITRUM
#3.2.9 GMX ON ARBITURM
#3.2.10 PENDLE ON ARBITRUM
#3.2.11 RDNT ON ARBITRUM
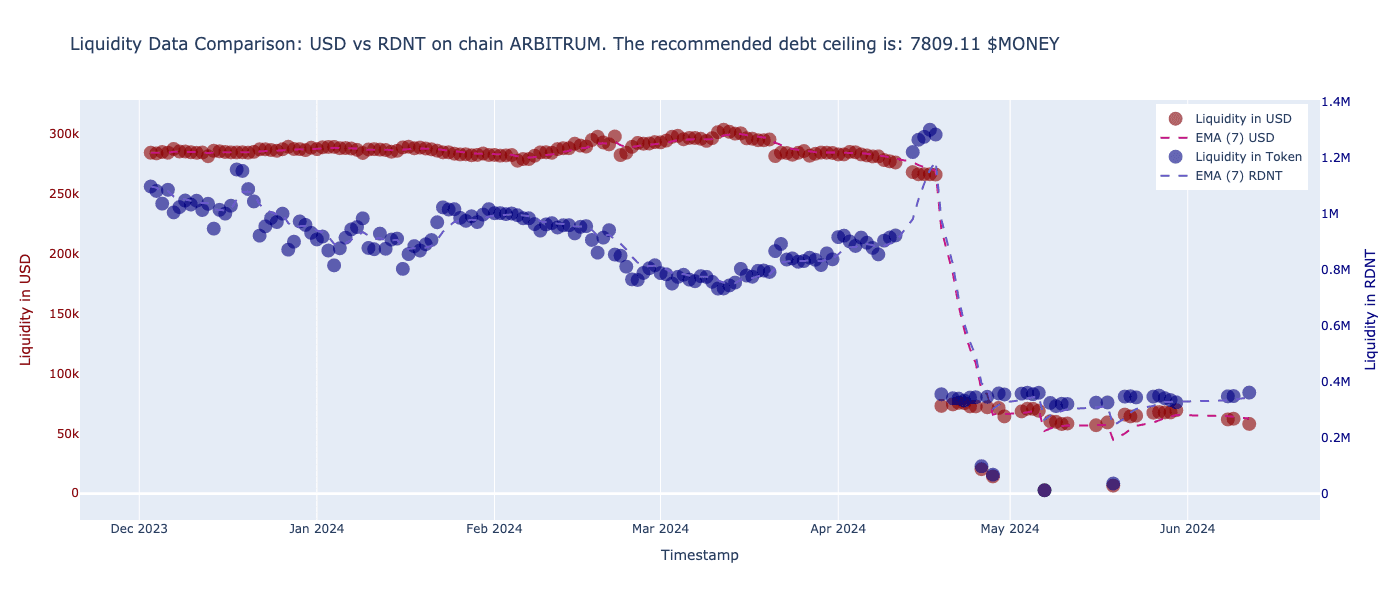
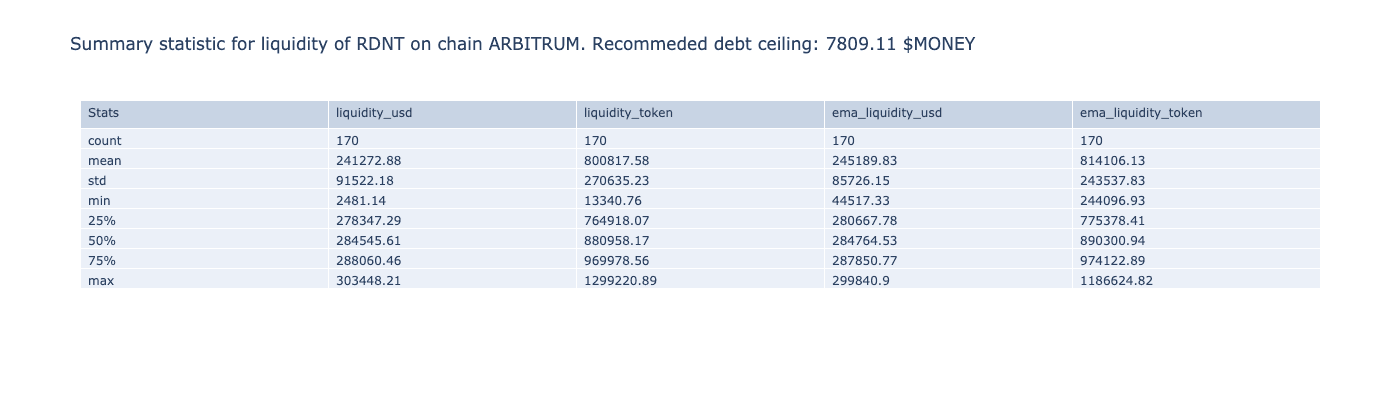
Note: $RDNT, despite being very liquid on Ethereum Mainnet, is very illiquid on Arbitrum and would not be recommended for listing. It may be reevaluated for onboarding at a later date as conditions for the asset change.
#Section 4: Oracle Selection
#4.1 Oracle Requirements
To determine the most suitable price feed for defi.money's requirements, a comprehensive analysis was conducted on Uniswap V3's TWAP and Chainlink feeds. The evaluation period spanned from January 1, 2024, to January 6, 2024, a timeframe characterized by significant price fluctuations in various crypto assets, providing a robust context for performance assessment.
Some relevant points to note in our initial investigation:
-
WBTC Chainlink Feed: The WBTC Chainlink feed on the Optimism chain is classified as medium risk by Chainlink. Additionally, the WBTC pools on Optimism exhibit very low liquidity, indicating the absence of a reliable oracle for WBTC on this chain.
-
GMX and Pendle Uniswap Pools: Uniswap pools for GMX and Pendle in Arbitrum chain, which are paired with USD stablecoins, suffer from insufficient liquidity and lack reliability.
-
Standard TWAP Interval: It is widely accepted and documented in various literature that a TWAP interval of half an hour is optimal for Uniswap V3. Consequently, this interval was adopted for price fetching in our analysis.
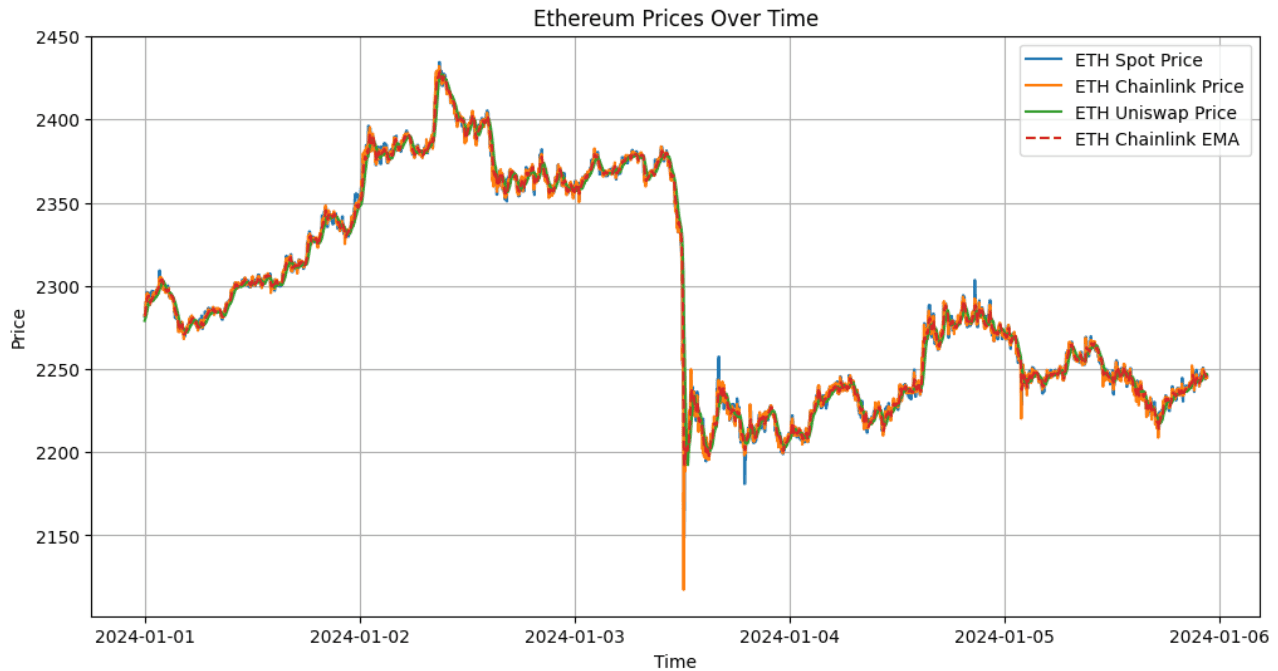
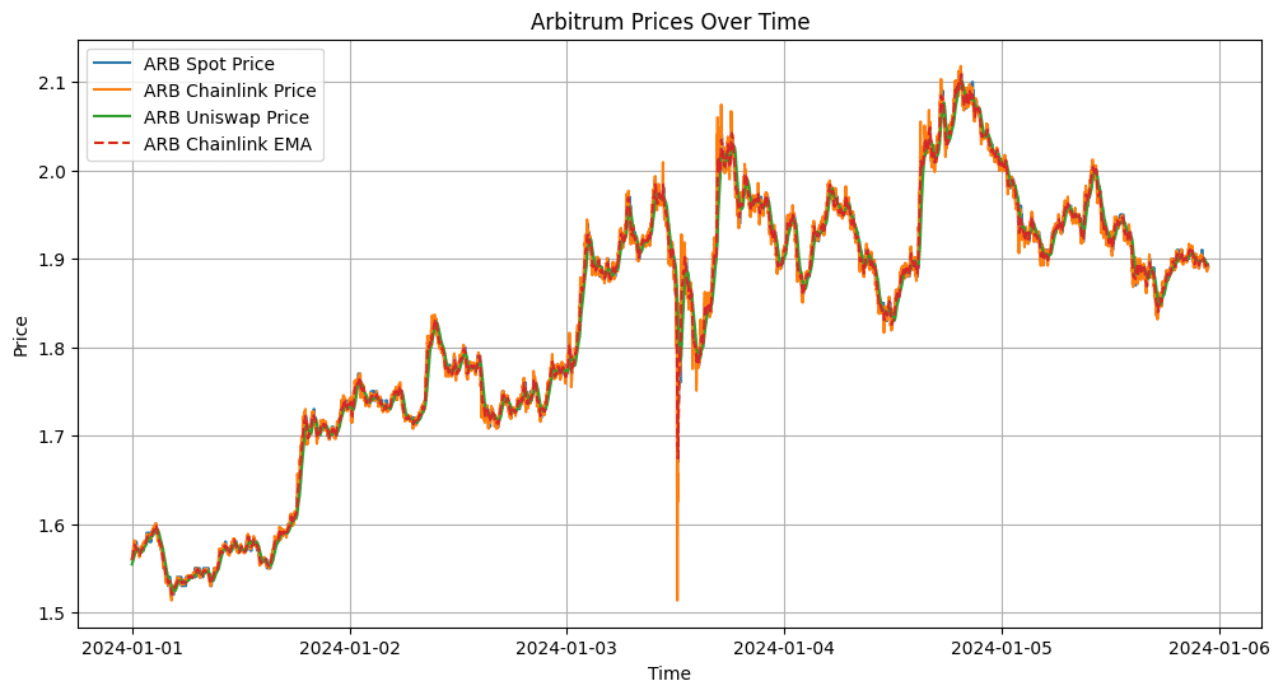
#4.2 Price Feed Comparison Charts
Following are the graphs of price feeds of Ethereum, Bitcoin and Arbitrum in Arbitrum chain, comparing Chainlink, Chainlink EMA, and Uniswap against a reference spot.
Ethereum:
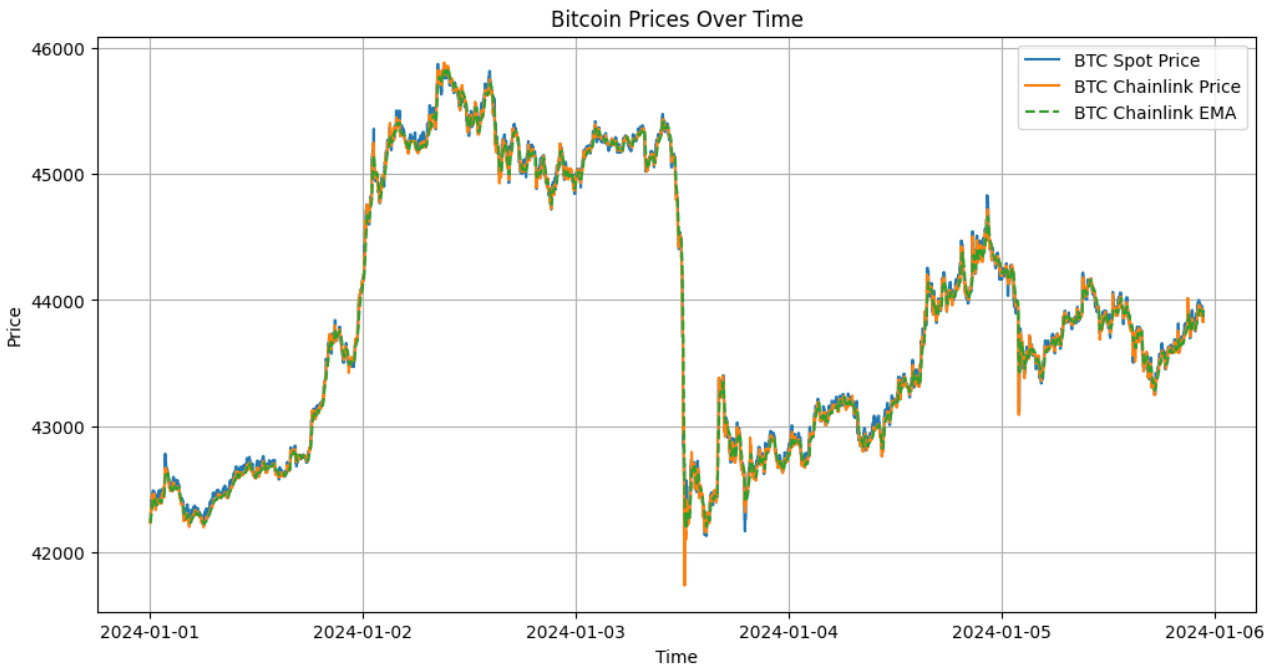
Bitcoin:
Arbitrum:
#4.3 Chainlink Feed Update Frequency Analysis
From the graphs above, one can observe that Chainlink prices usually have very sharp drops, and also lag in updating the price. Hence, we have done an analysis of update times in Chainlink feeds.
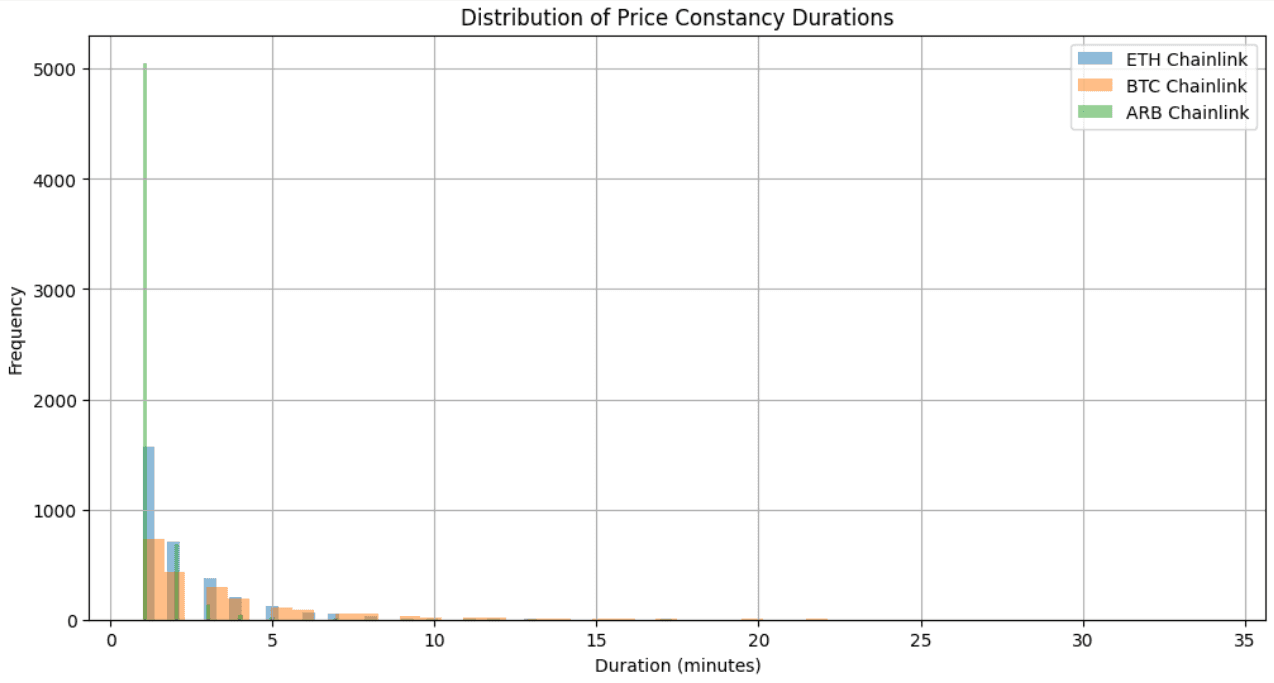
The duration for which Chainlink prices remained constant was calculated to understand the frequency of updates. The analysis provided insights into the regularity and reliability of the Chainlink price feeds for ETH, BTC, and ARB.
Key Findings:
ETH Chainlink Feed:
BTC Chainlink Feed:
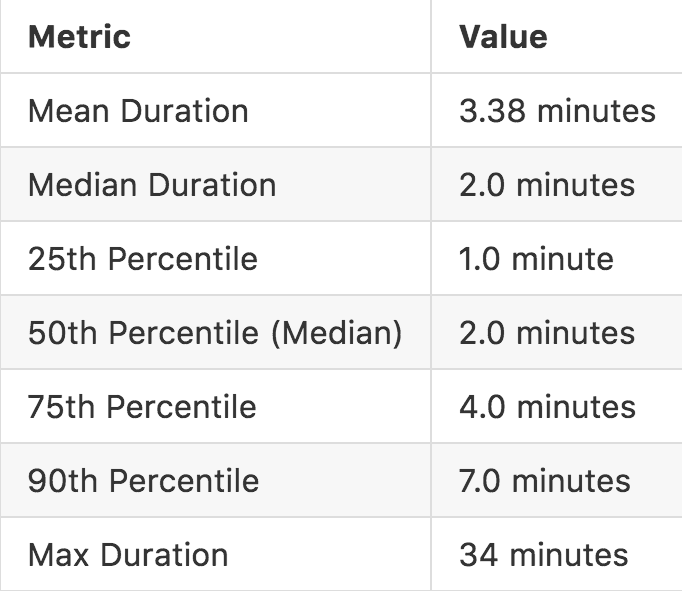
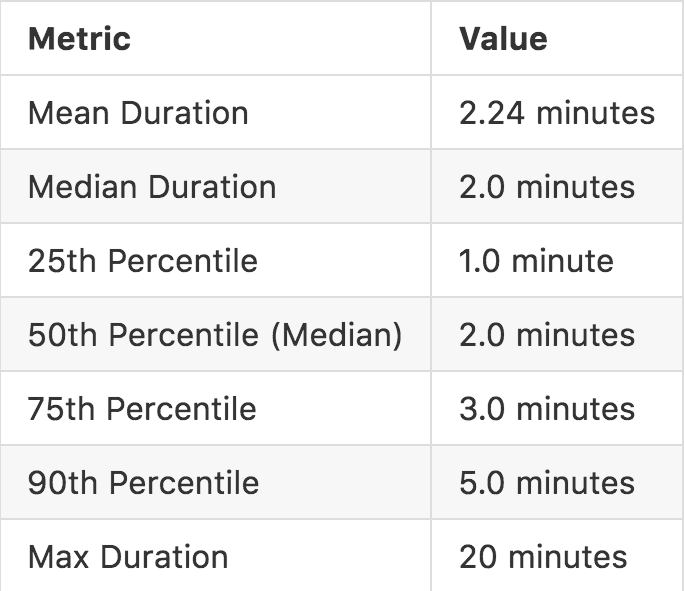
ARB Chainlink Feed:
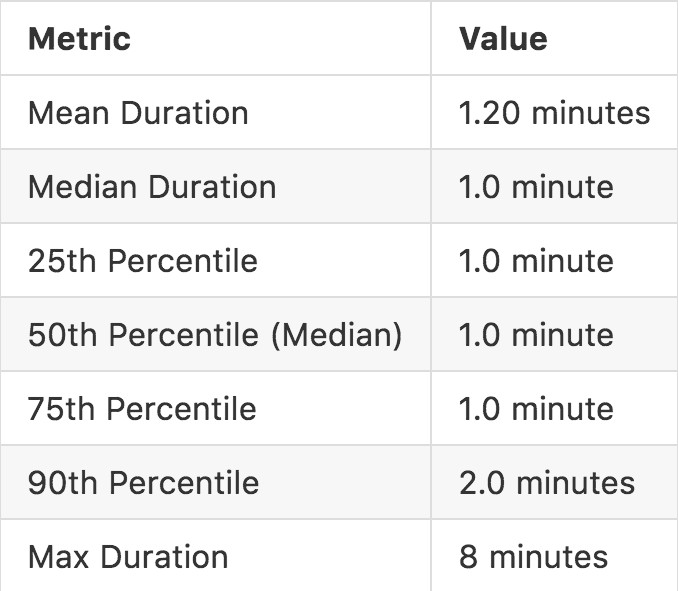
Interpretation of Percentile Data:
-
25th Percentile: Indicates that 25% of the time, the price remained unchanged for 1 minute or less.
-
50th Percentile (Median): Shows that 50% of the time, the price remained unchanged for 2 minutes or less for ETH and BTC, and 1 minute or less for ARB.
-
75th Percentile: Reveals that 75% of the time, the price remained unchanged for 3 minutes or less for ETH, 4 minutes or less for BTC, and 1 minute or less for ARB.
-
90th Percentile: Indicates that 90% of the time, the price remained unchanged for 5 minutes or less for ETH, 7 minutes or less for BTC, and 2 minutes or less for ARB.
-
Max Duration: Represents the longest duration for which the price remained constant, highlighting potential periods of inactivity or delayed updates.
These findings illustrate that Chainlink price feeds for ETH and BTC generally have moderate update frequencies, with occasional longer periods of inactivity. The ARB Chainlink feed updates more frequently but also exhibits some irregularity. This analysis underscores the need to consider these update patterns when relying on Chainlink feeds for real-time applications.
#4.4 Statistical Metrics for Price Feed Performance
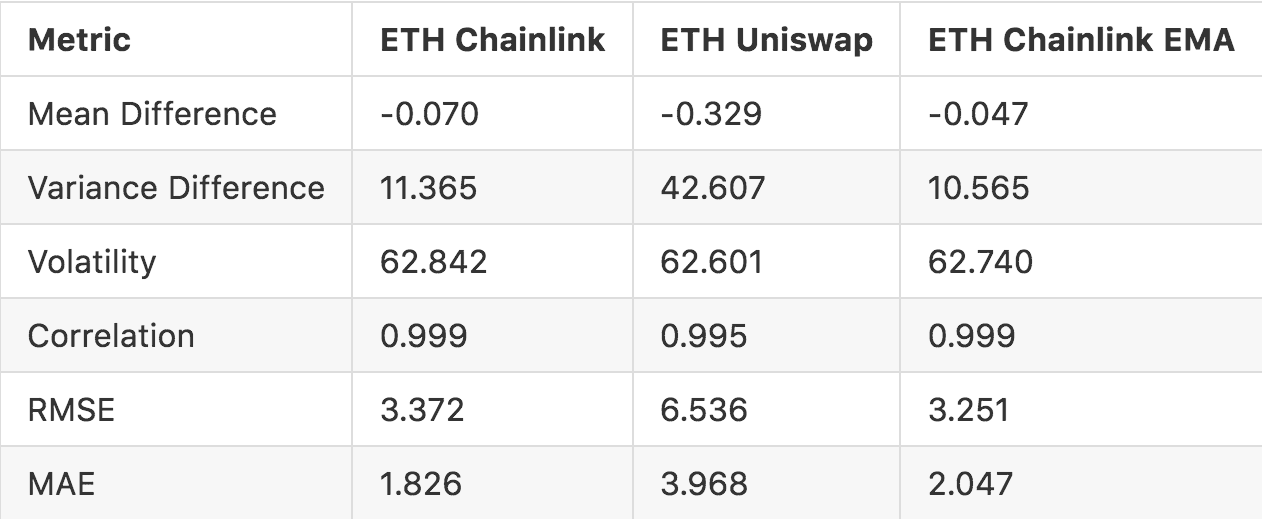
The analysis focused on comparing different price feeds to assess their reliability, volatility, and overall performance. The primary price feeds examined were Chainlink, Uniswap TWAP, and the Exponential Moving Average (EMA) derived from the Chainlink feed. The baseline prices were taken from spot prices for ETH, BTC, and ARB.
Ethereum (ETH)
-
Mean Difference: Measures the average deviation of each price feed from the baseline spot price.
-
Variance Difference: Assesses the variability of the differences between each price feed and the baseline.
-
Volatility: Standard deviation of the price feed values, indicating the level of fluctuation.
-
Correlation: Pearson correlation coefficient between the price feed values and the baseline spot prices.
-
RMSE (Root Mean Square Error): Quantifies the difference between the price feed values and the baseline spot prices.
-
MAE (Mean Absolute Error): Average absolute difference between the price feed values and the baseline spot prices.
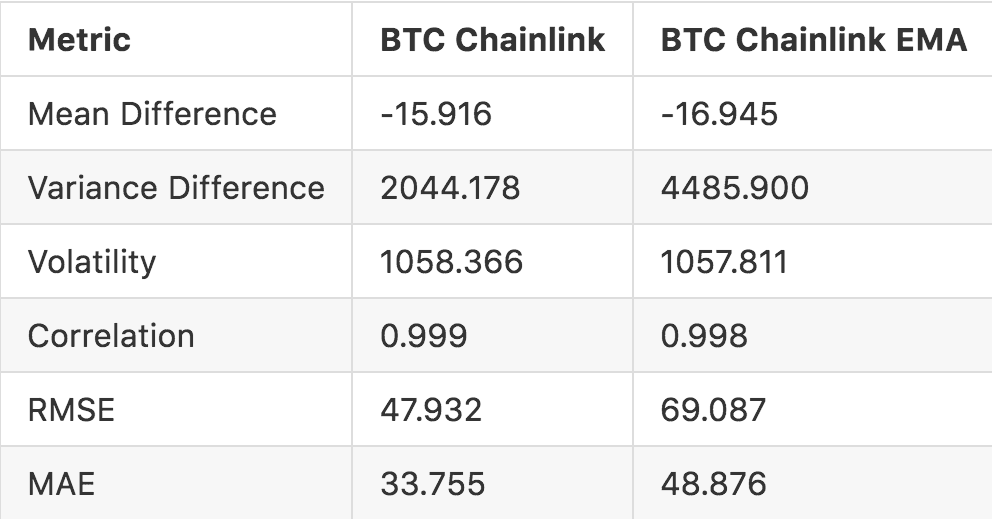
Bitcoin (BTC)
- Similar statistical metrics were calculated, but BTC analysis encountered some data gaps which needed handling.
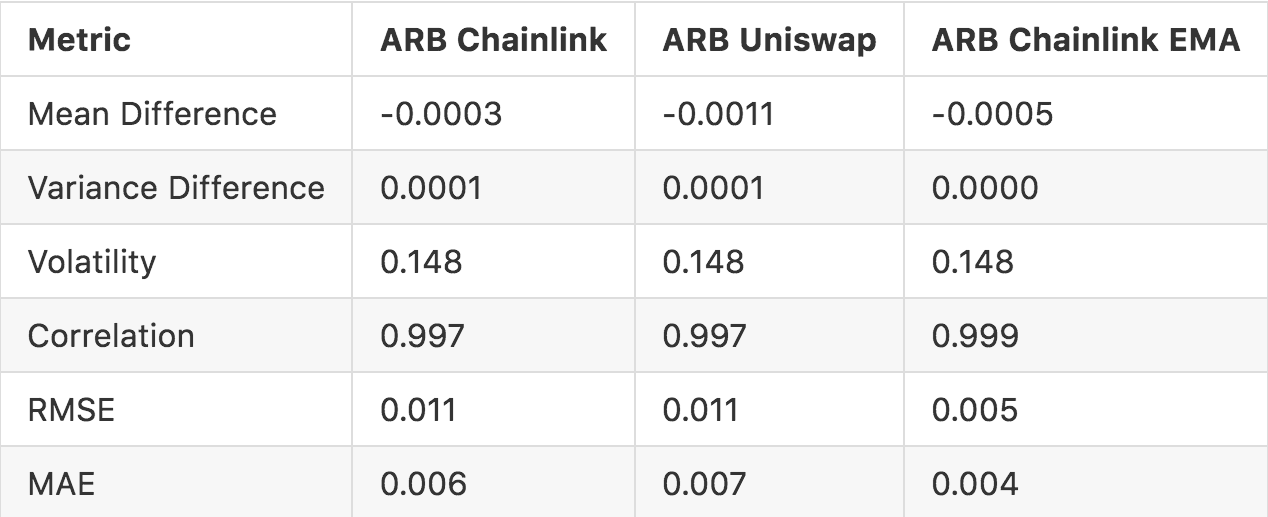
Arbitrum (ARB)
- Similar statistical metrics were calculated.
Comparison with Baseline Prices
-
The statistical metrics highlighted significant discrepancies between the price feeds and the baseline spot prices.
-
The Chainlink feed generally showed lower volatility compared to the Uniswap feed, but it exhibited occasional sharp drops or rises, which could lead to less reliability in highly volatile conditions.
-
The Uniswap TWAP feed, influenced by liquidity, showed a higher correlation with the baseline prices but had higher volatility.
Volatility Analysis
-
The volatility analysis compared the standard deviation of the price feeds.
-
The Chainlink feed exhibited moderate volatility, reflecting its relatively stable updates.
-
The Uniswap feed showed higher volatility, particularly in pools with lower liquidity.
-
The EMA smoothed out short-term fluctuations, resulting in reduced volatility compared to the raw Chainlink feed.
EMA Analysis
-
The EMA was evaluated as a smoothing technique for the Chainlink price feed.
-
The EMA showed lower mean and variance differences compared to the raw Chainlink and Uniswap feeds, indicating better alignment with the baseline prices.
-
The EMA demonstrated a higher correlation with the baseline prices, suggesting it is a more reliable indicator in the presence of sharp price movements.
#4.5 Optimal Oracle Conclusion
The analysis reveals that a 10 minute Chainlink EMA outperforms other price feeds most of the time, even surpassing the regular Chainlink feed when updates are frequent. The Bitcoin Chainlink EMA didn't perform as well, probably due to high feed update time. Uniswap V3, on the other hand, exhibits price discrepancies not only due to its DEX-based data source but also because of how prices are internally represented within the smart contract. The conversion process from Tick to sqrtPriceX96, and subsequently to a fixed-point price, introduces precision loss. This loss occurs during the mulDiv operation, further compounding inaccuracies. Consequently, these findings strongly support the use of the Chainlink feed with EMA for more reliable and accurate price data.
#Section 5: Summary and Recommendation
#5.1 Market Configuration Summary
The findings described above are compiled below to summarize a recommended market configuration for each proposed collateral asset considered to onboard in the Defi.Money alpha launch.
The configurations are based purely on the described methodology and are not necessarily consistent with our deployment recommendation based on this data (our recommendation is given below in section 5.2).
#5.1.2 Optimism Markets
#$WETH
#$WBTC
#$wstETH
#$OP
#$VELO
#5.1.3 Arbitrum
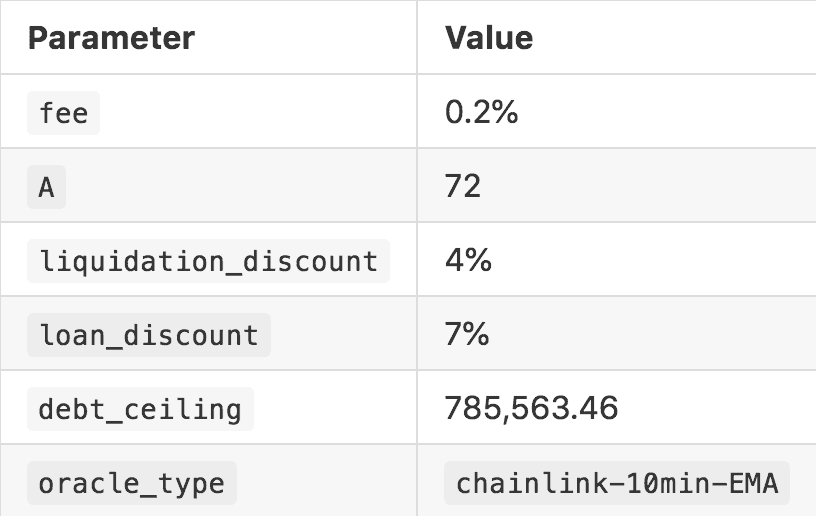
#$WETH
#$WBTC

#$wstETH
#$ARB
#$GMX
#$PENDLE
#$RDNT
Note: Unlikely Simulation results - recommend to revisit later on
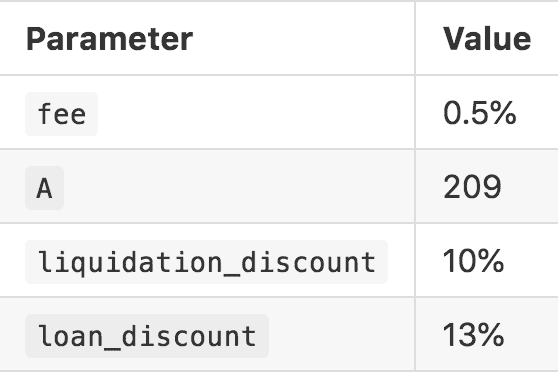
#5.2 LlamaRisk Recommendation
Our opinion, informed by the analyses described above, is offered to assist Defi.Money in its deployment strategy. Our preference is to err on the conservative side, especially since the alpha launch will be a big undertaking in itself. This will include considerations such as the deployment of pegkeeper pools, a native token, and cross-chain capability. Our general recommendation is to, therefore, deploy with a few highly liquid markets and gradually onboard additional markets over time.
Our view is that deployment to a single chain initially may be more manageable and give time to ensure the system is stable before expanding to other chains. We understand, however, that Defi.Money places high importance on its cross-chain product offering and may prefer to deploy on Arbitrum and Optimism simultaneously. If an initial deployment chain were selected, Arbitrum presents a more compelling opportunity in terms of diversity of potential collateral assets and liquidity depth for both prospective collateral types and pegkeeper stablecoins.
As Defi.Money likely will prefer the dual-chain launch, we recommend limiting initial markets to a selection of the three most liquid assets on each respective chain. This would include onboarding:
-
Arbitrum: WETH, WBTC, ARB
-
Optimism: WETH, WBTC, wstETH
In the case of both chains, WETH is the most liquid asset by a wide margin, and an obvious choice for suitable collateral onboarding. wstETH is somewhat surprisingly more liquid on Optimism than on Arbitrum, making it a more suitable selection for Optimism. This is the case despite a much larger wstETH token supply on Arbitrum; in fact, ARB, GMX, and PENDLE all exhibit stronger liquidity profiles than wstETH on Arbitrum.
Our initial research into oracle options suggests that Chainlink feeds processed by a 10-minute EMA offers the optimal choice for Defi.money's oracle requirements (compared to a Uniswap TWAP feed). Its properties make it deviate less from spot price while maintaining the smoothing attribute advisable for use with the LLAMMA liquidation algorithm. Defi.Money may select this oracle choice initially and transition to an oracle based on Curve EMA oracles, depending on its strategy for pool incentivization and liquidity developments generally related to Curve pools relevant to Defi.money markets.
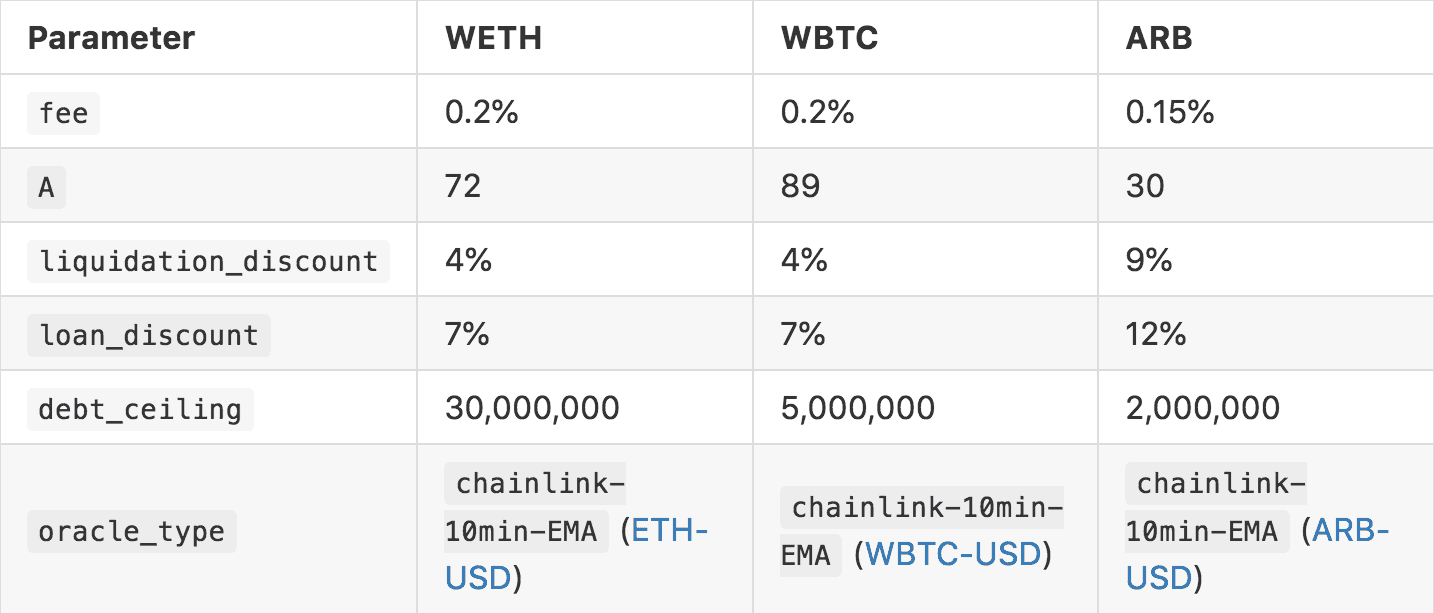
Initial recommendations outlined here would include the following markets with market configurations:
Optimism
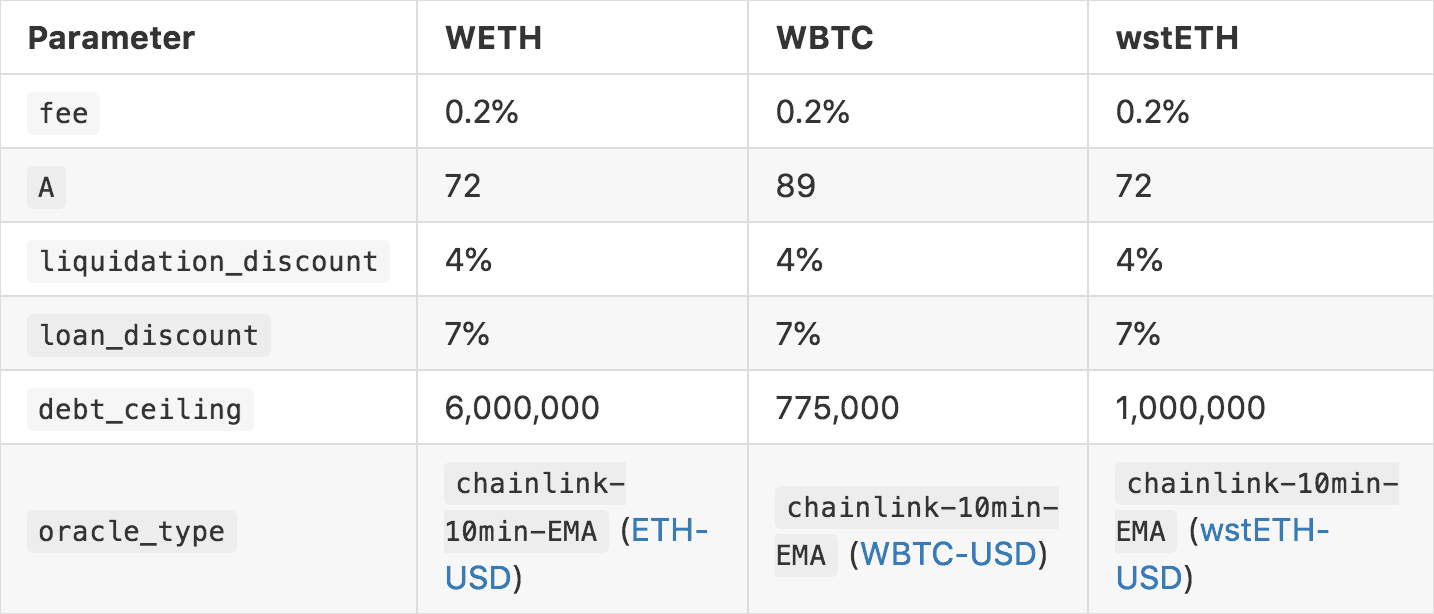
-
Chainlink ETH feed: ETH-USD
-
Chainlink WBTC feed: WBTC-USD
-
Chainlink wstETH feed: wstETH-USD
Arbitrum