Collateral onboarding recommendations for initial Defi.Money deployment on Base chain
#Introduction
The following report presents parameterization recommendations for a list of collaterals to be listed in the initial deployment of Defi.money on Base chain. The parameter recommendations are based on the methodology presented in the final report of the previous delivery in which we recommended markets onboarding to Optimism and Arbitrum chains.
Our conclusion is to onboard WETH, cbBTC, and cbBTC initially with wstETH onboarding to follow in the near future. In general, we have found Base chain to offer a good selection of high quality assets with deep liquidity to support Defi.money markets. The aforementioned assets are, in our opinion, the strongest contenders, and we intend to review additional collateral types in the coming weeks.
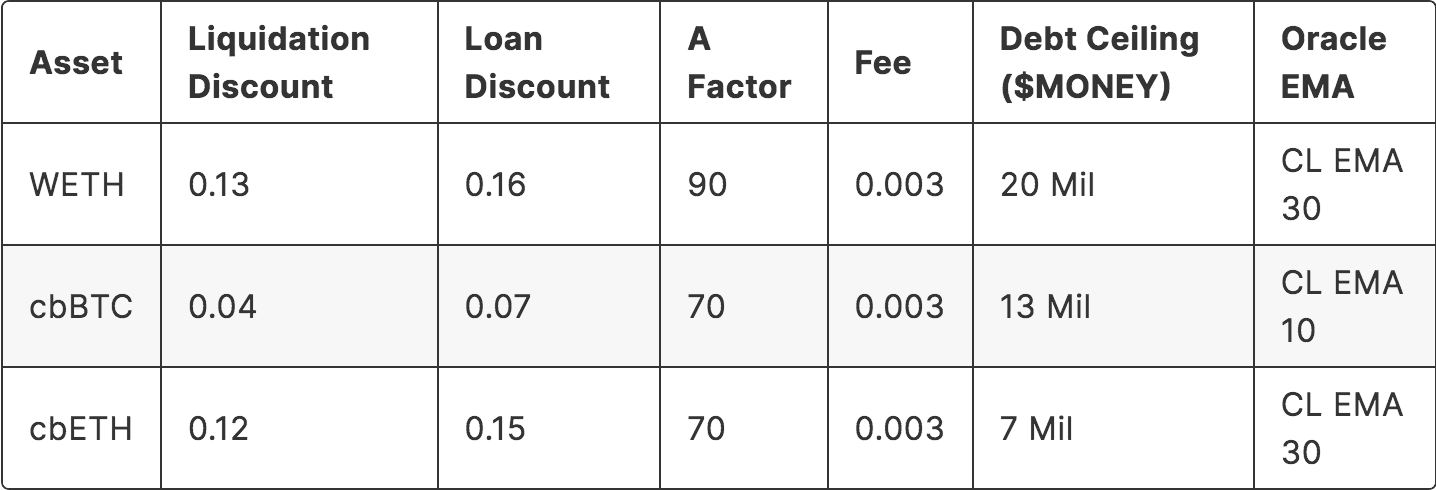
Our analysis described in this report offers our rationale for assigning optimal parameters, safe debt ceilings, and oracle EMA times for these markets. The overall recommendation is provided here:
Update: 11/7/24

#Recommendation
The markets onboarding recommendation is divided into three subsections:
-
Market Parameters: Optimal parameters that minimize bad debt and maximize protocol revenue based on our simulation output analysis.
-
Debt Ceiling: An initial safe recommended debt ceiling for markets based on available liquidity to service potential liquidations.
-
Oracle EMA: Chainlink EMA time optimized to reduce price feed volatility, maximize correlation to spot price, and minimize magnitude of error from spot.
#1 Market Parameters
The following table presents the recommended parameters for collaterals on Base:

Update: 11/7/24

The optimal market parameters are obtained by localization. For a fixed liquidation discount, we identify trends in simulation metrics by varying the rest of the parameters. For more details, we invite the reader to consult the Appendix. Given below are the simulation results for each market along with a brief rationale for our selection.
#WETH
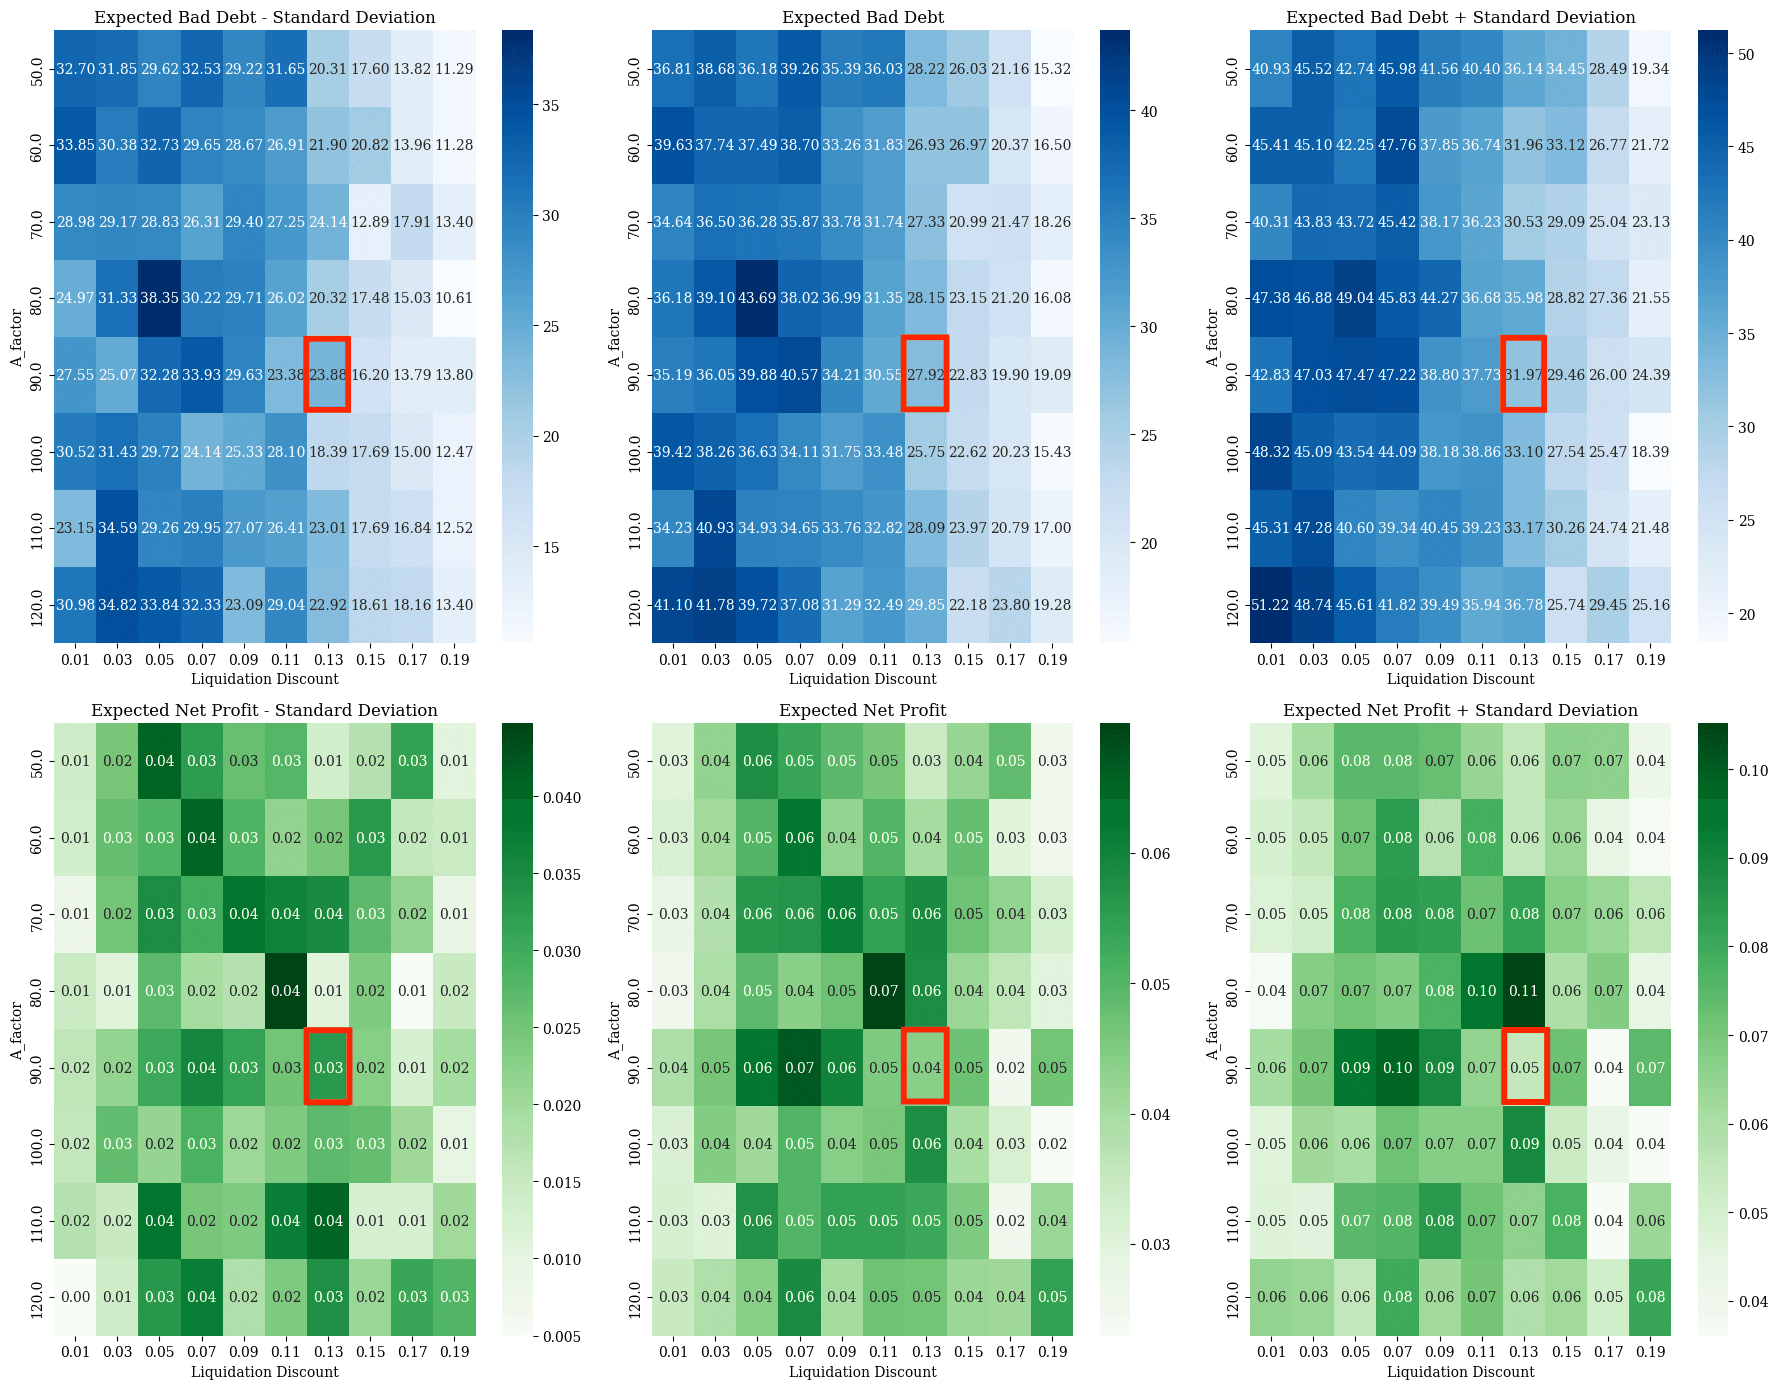
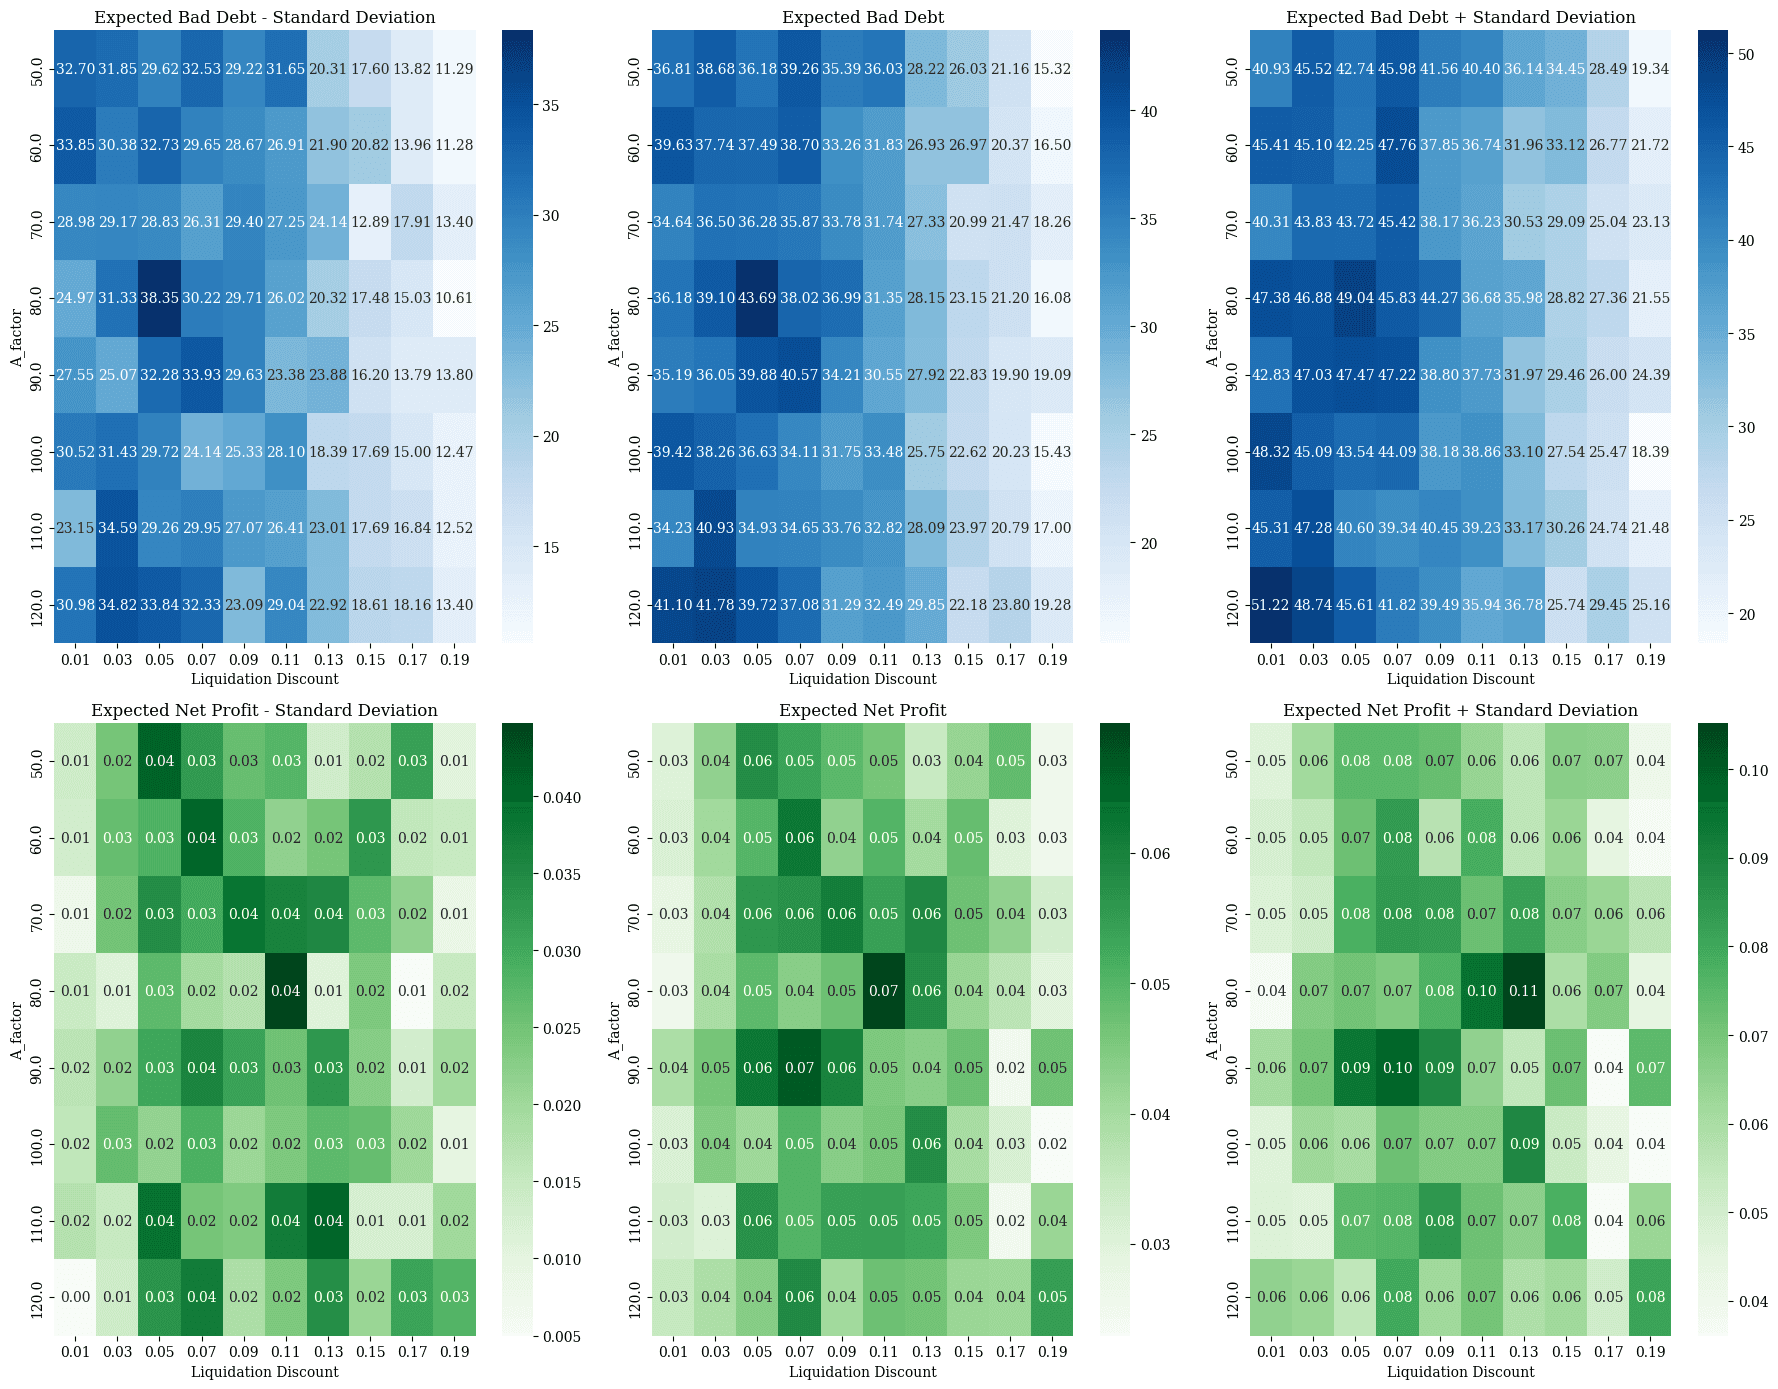
Results show a trend of progressively favorable bad debt accrual as liquidation discount increases whereas net profit tends to maximize around A=70-90 and liquidation discount between 0.05-0.13. We select A=90 and liquidation discount=0.13 as a suitable balance between these factors.
#cbBTC
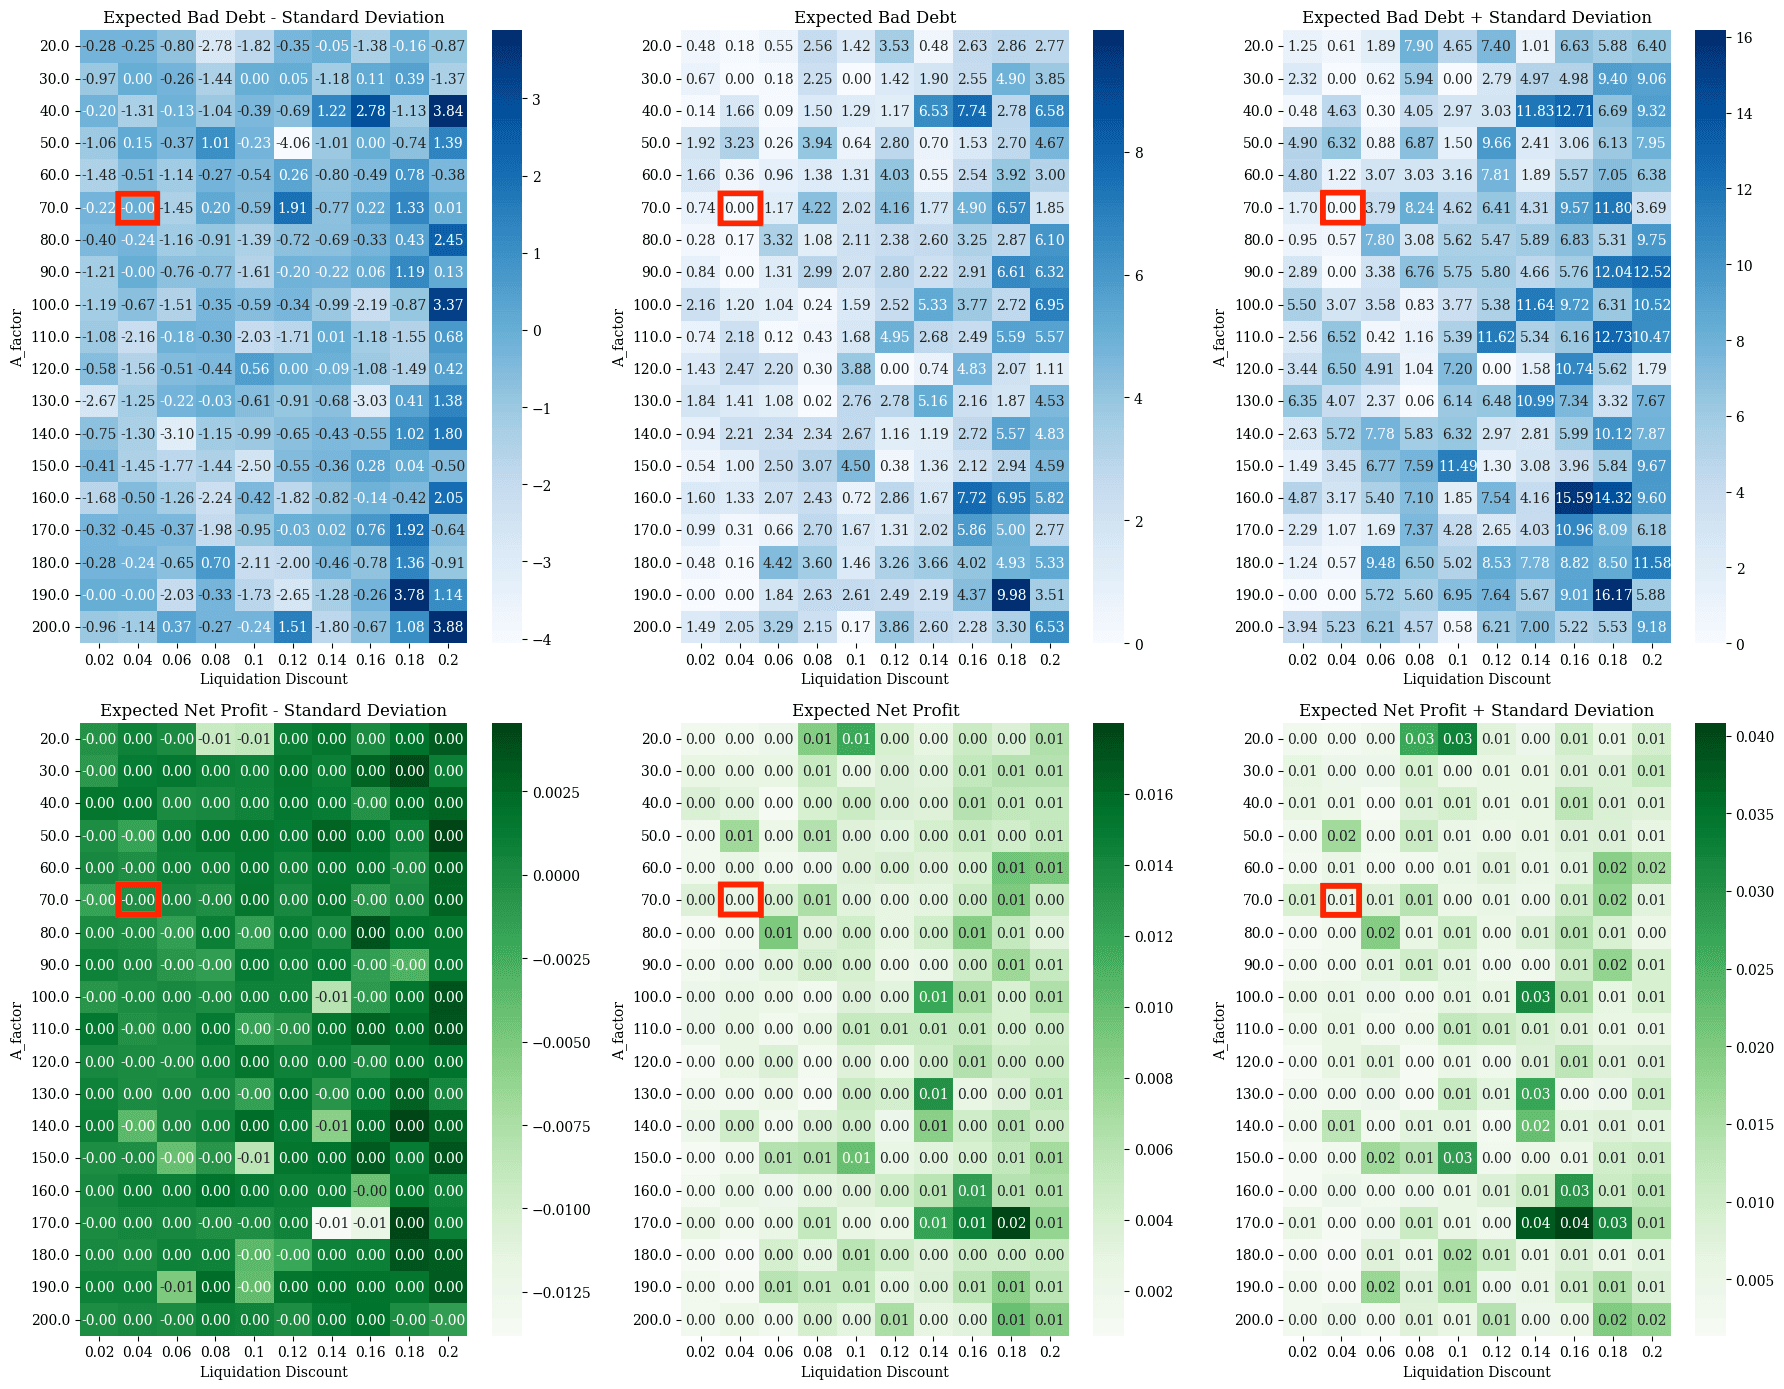
There are several suitable ranges to parameterize cbBTC. We have selected A=70 and liquidation discount=0.04 where bad debt is minimized. It is also the most aggressive parameter selection of all markets, allowing for the highest max LTV. This is consistent with the expectation that cbBTC should be among the least volatile of onboarded markets, assuming efficient redemptions that ensure a stable peg to BTC.
#cbETH
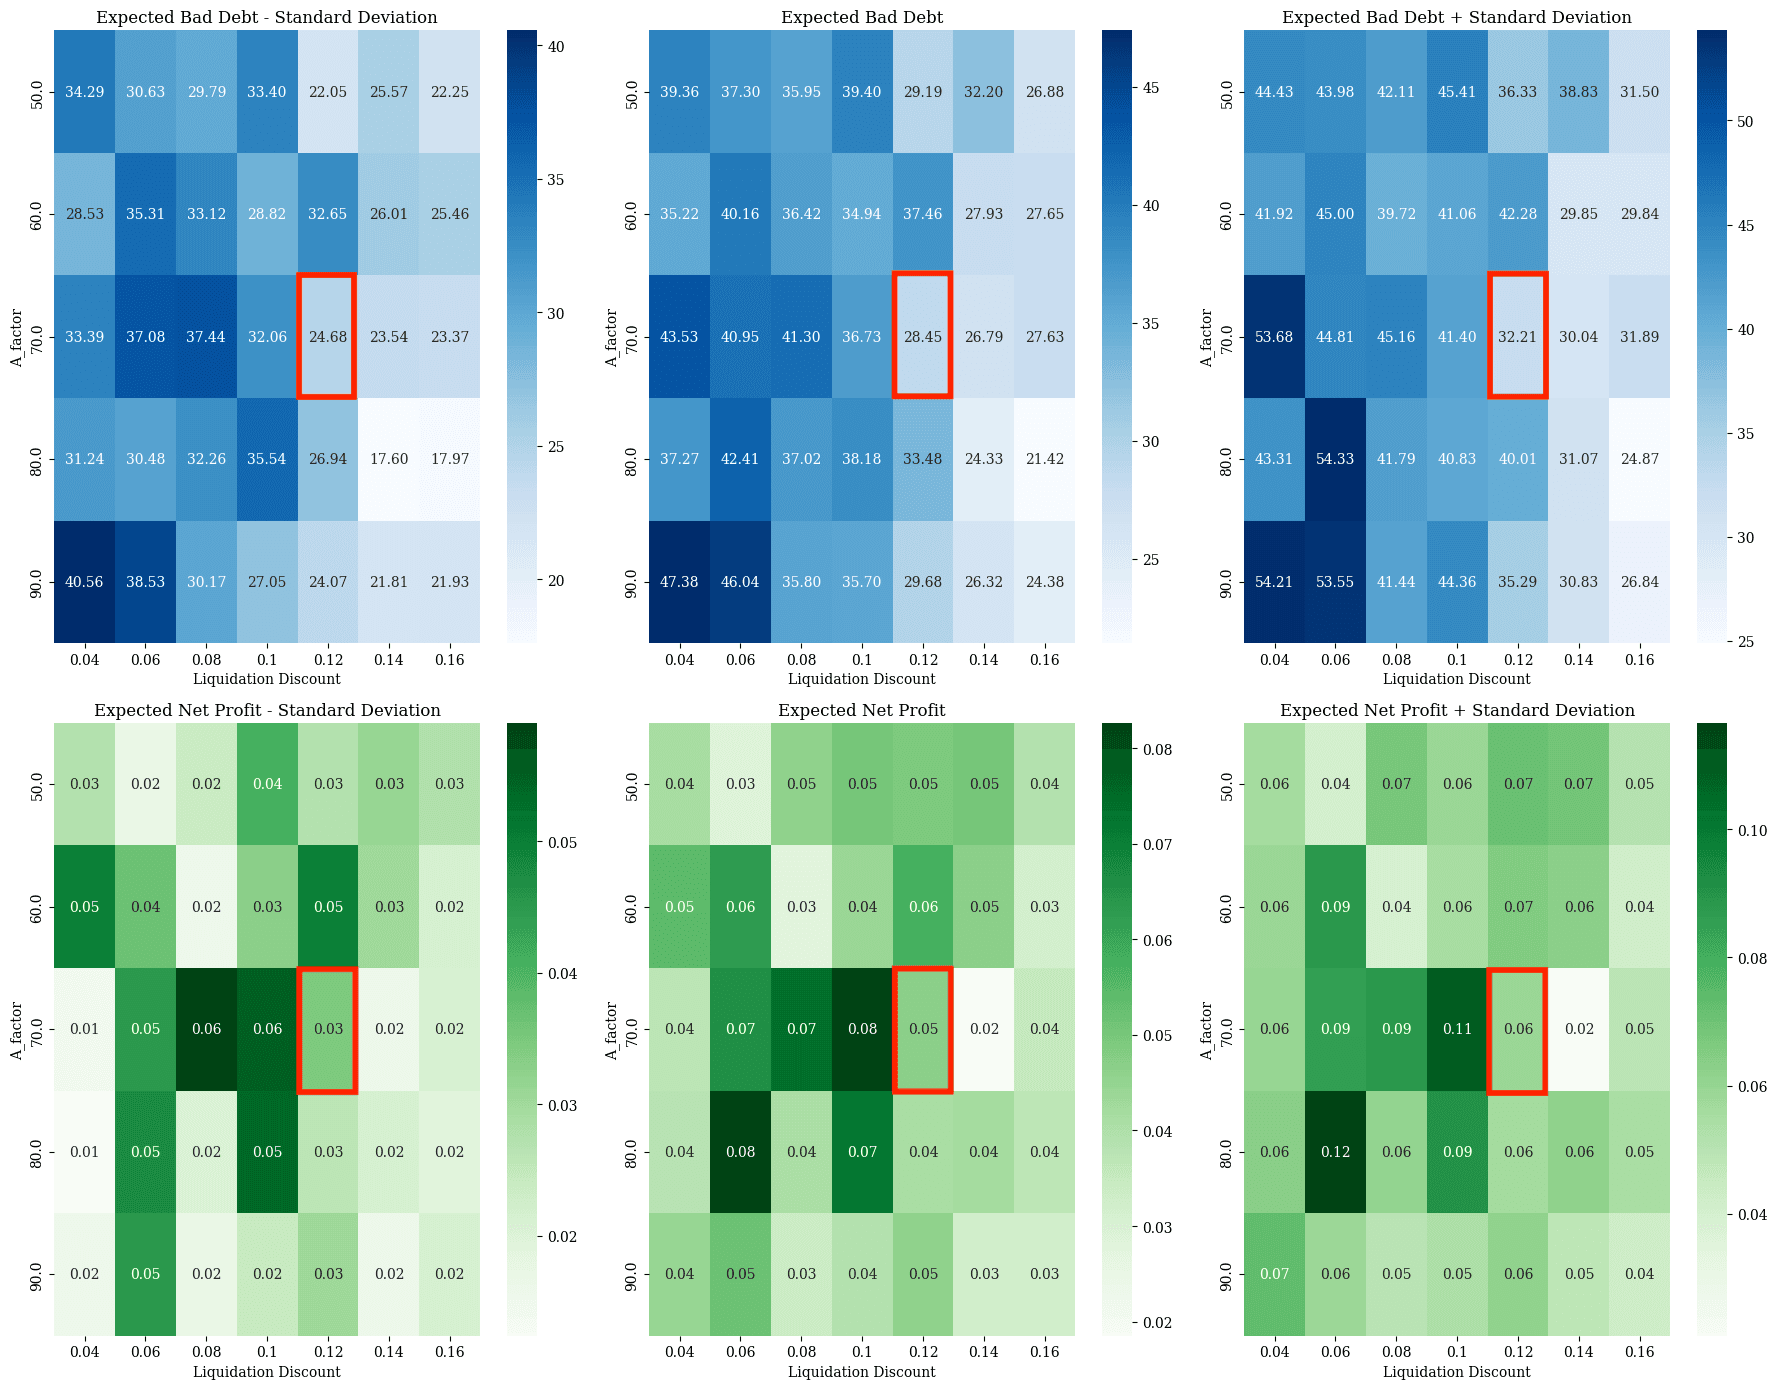
Similar to WETH, bad debt shows a clear trend of decreasing as the liquidation discount increases. Net profit performs well around A=70-80 and liquidation discount=0.06-0.12. We have selected the most aggressive value in the safe range, closely resembling the parameter selection for WETH.
Update 11/7/24
#wstETH
For wstETH, we have cross-referenced simulation output between our crvUSDrisk tool and llama-simulator. This was due to there being several optimal parameter selections, making it important to get a second opinion.
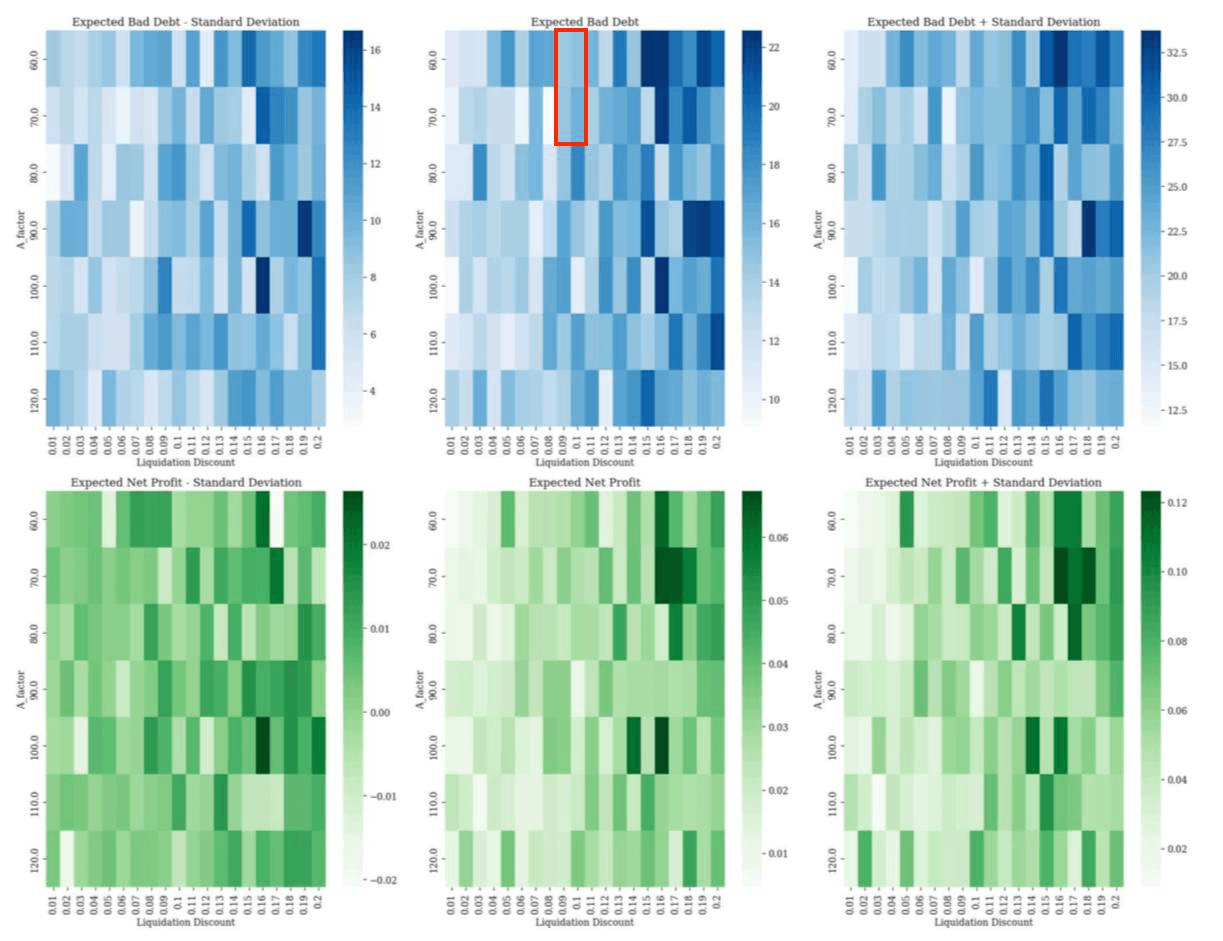
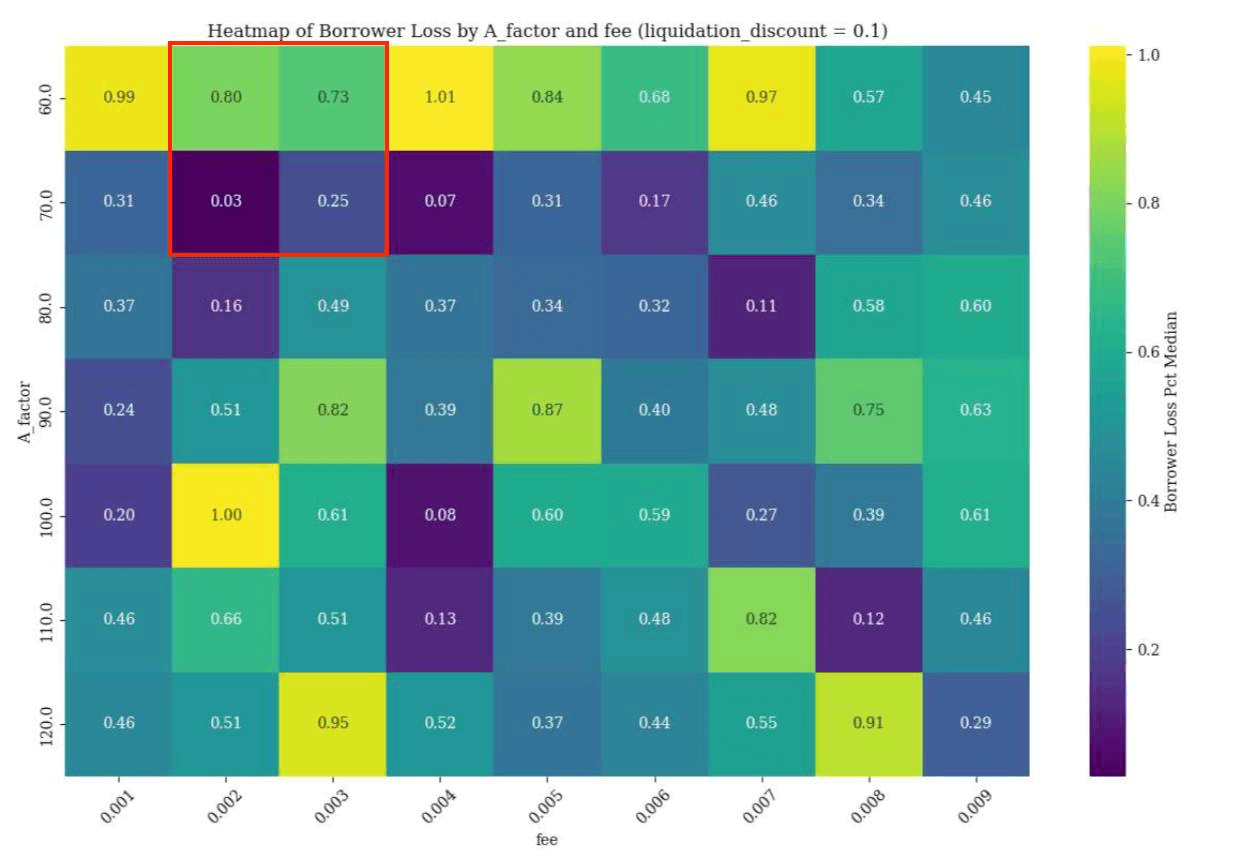
Our tool found a suitable range of 0.09-0.1 liquidation discount and 60-70 A factor. An A factor of 70 and fee of 0.002-0.003 was found to be a suitable range.
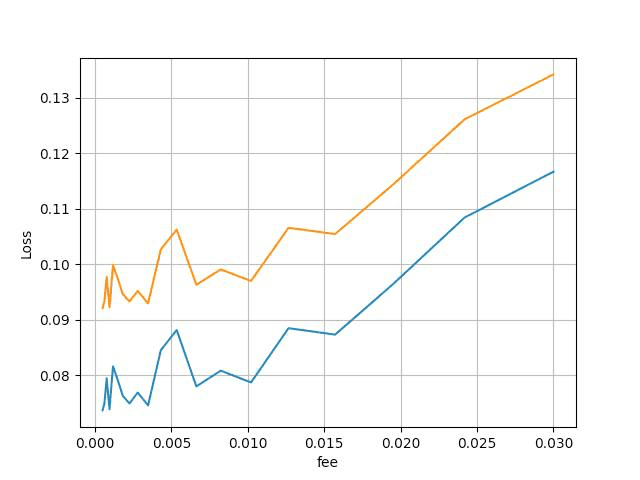
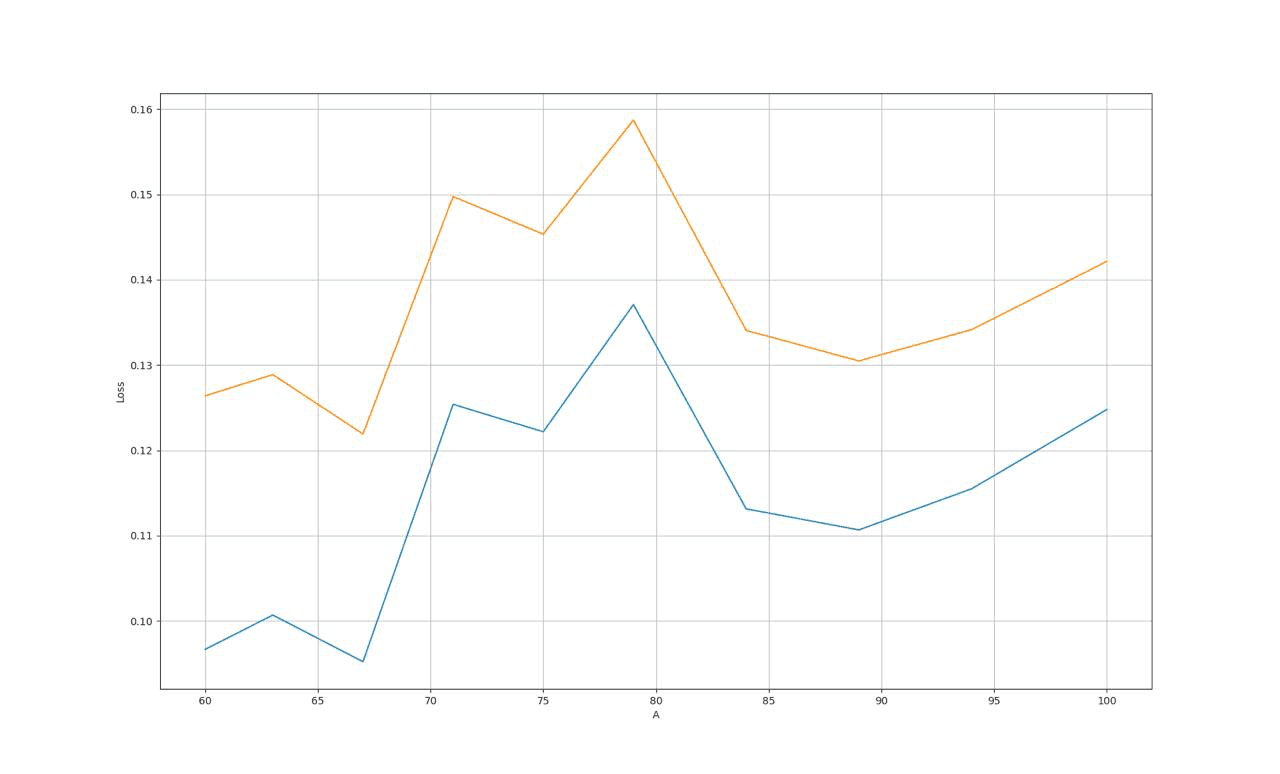
Referencing against llama-simulator, the above fee range again proves to be optimal. An A factor of ~65 with a liquidation discount of 0.09-0.1 was found to result in least borrower losses.
#Analysis Notes
-
Additional details of our simulation output can be found in the appendix.
-
The liquidity behavior of Pegkeeper pools uses Optimism chain as a proxy, since no data is currently available on Base.
-
cbBTC is a new asset without much historical market data. We have simulated its behavior using WBTC as a proxy, since both are custodial BTC tokens expected to exhibit similar market behaviors.
-
Techbycheff clustering methodology works best when there is additional exploratory data analysis done to explain the behavior of the parameters. This analysis is carried out in the Appendix. The analysis of the simulation data is moved to the appendix.
#2 Debt Ceiling
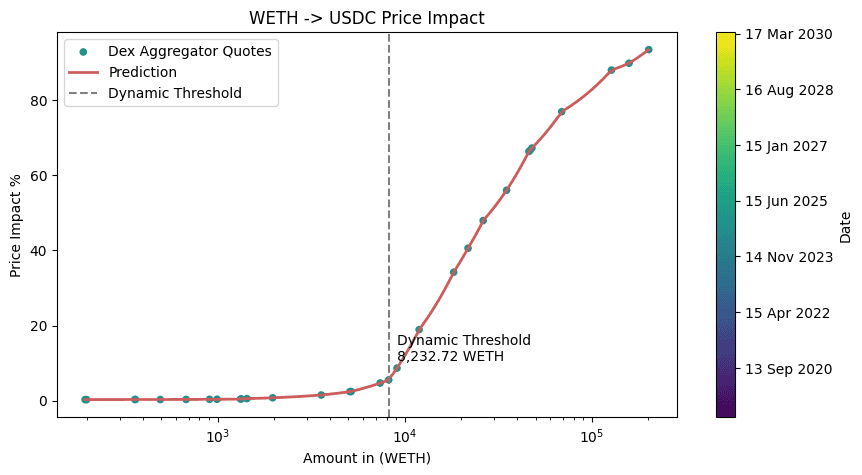
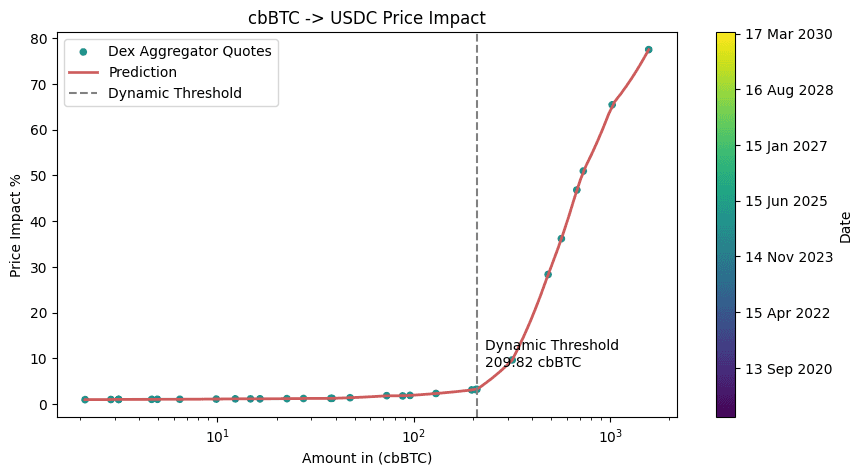
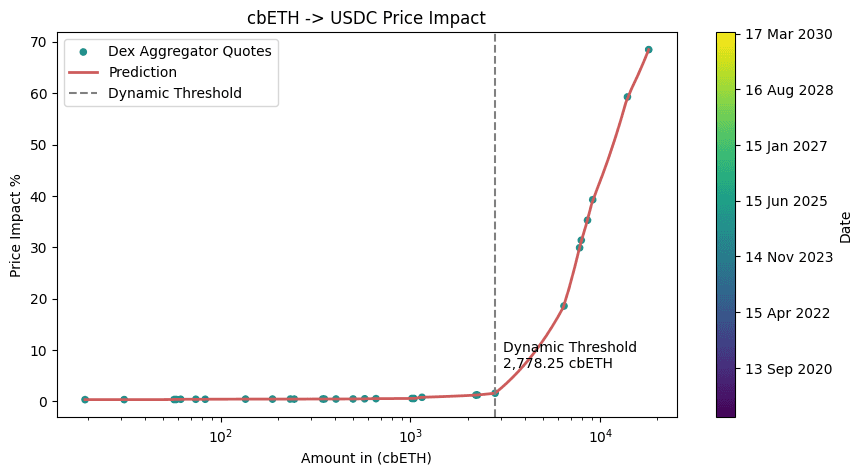
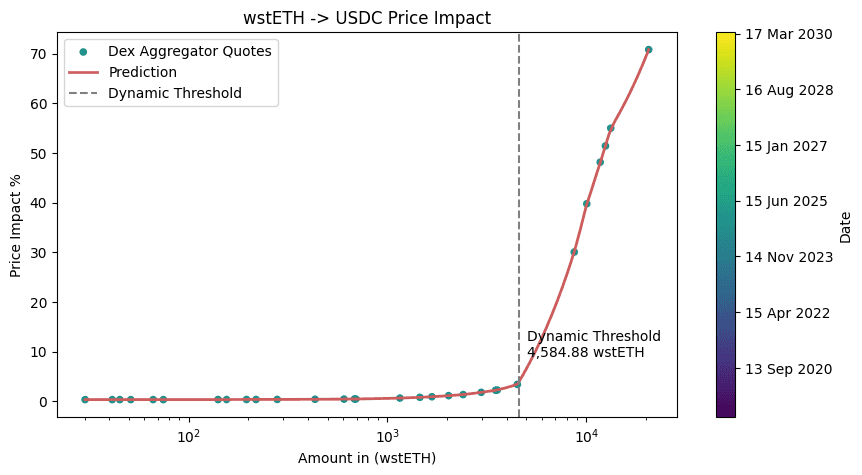
The debt ceiling is determined based on the collateral sale price impact (cf. section 4.2 in final report). The table below denominates the recommended slippage tolerance defined by our methodology into MONEY for convenient cross-comparison between liquidity depth and to set a safe debt ceiling for the respective markets. Exposures are calculated by a recent price quote on October 15, 2024 and recommended values are subject to fluctuation depending on the liquidity depth and price trajectory of the collateral assets.

Update: 11/7/24

We solely relied on USDC quotes for fitting the isotonic regressor and defining the debt ceiling given the overwhelming concentration of USDC on Base relative to other stables.

Source: DefiLlama
Below we display the initial recommended debt ceiling for each onboarded market.
#WETH
#cbBTC
#cbETH
Update: 11/7/24
#wstETH
#3 Oracle EMA
This section presents an analysis of Chainlink Oracles intended for use on DeFi.Money's Base deployment. The quality of the oracles is critical to the overall architecture of the platform. These oracles ensure that borrowers can take out loans accurately priced against their collateral, arbitrageurs can efficiently execute soft-liquidations, and liquidators can perform hard-liquidations effectively.
For this analysis, we review each asset's price feed page on Chainlink’s website (e.g., for ETH/USD) and compare the attributes listed for each respective asset. Following this, we conduct a quantitative analysis to evaluate the performance of the oracles utilized.
DeFi.Money will employ an EMA period for quoting their stablecoin, $MONEY, against specific collateral. This experiment enables us to identify an EMA period that prevents arbitrageurs from triggering soft-liquidations too aggressively during periods of high volatility.
#Price Feed Parameters
The following table lists attributes for each asset's associated Chainlink oracle.

Most of these attributes appear reasonable. ETH/USD requires constant updates, which must be reactive to even minor deviations from off-chain prices. Similarly, for cbETH, it is expected that Coinbase would want to maintain competitiveness with wstETH.
The cbBTC oracle, however, raises some concerns. The deviation threshold is notably higher than the other USD-paired feeds, as is the latency, which demands extra attention regarding the reliability of this oracle.
#EMA Analysis Methodology
We first identify the "safest" EMA period for a given oracle price feed and subsequently evaluate the performance of the oracle with this selected EMA period.
Determining a safe EMA period for a Chainlink oracle's price feed is essential for the security of DeFi.Money's protocol. It is important to protect borrowers from the impact of high volatility to ensure they are not prematurely or excessively liquidated during such periods. In this study, we analyzed the performance of 10-, 30-, and 60-minute EMA periods.
When selecting this safe period, it is necessary to balance several key metrics that measure the difference between the predicted value of spot prices and the actual values:
-
Correlation with the Spot Price
-
Volatility
-
Magnitude of Error/Difference from the Spot Price
In other words, while volatility should be minimized, the predicted price should not deviate significantly from the spot price. To put it differently, liquidations should not be excessively aggressive, yet positions must be liquidated when necessary.
We use the difference between the Root Mean Squared Error (RMSE) and Mean Absolute Error (MAE) of the predicted prices compared to the spot prices to assess the magnitude of error.
Note: time range analyzed was between 16 Oct 2024, 10:30:00 and 16 Oct 2024, 15:47:51 UTC, with a granularity of 1-minute
#ETH/USD Price Feed
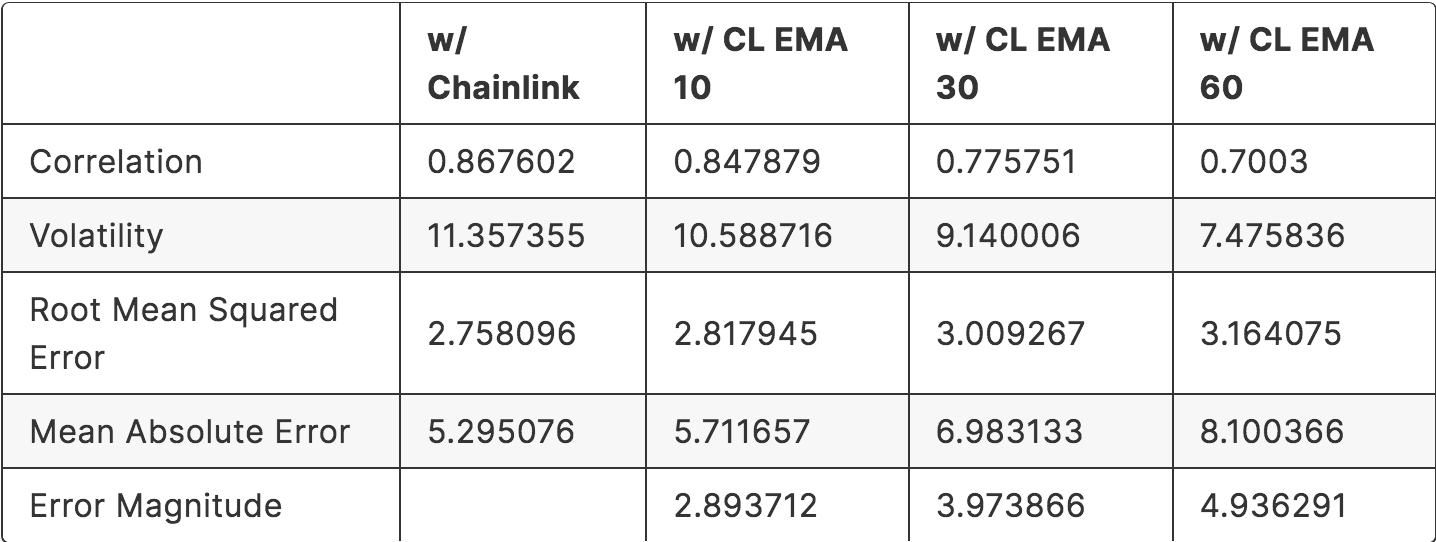
ETH/USD Price Feed Timeseries

Oracle Price Feed Latency Distribution
The following latencies were tracked from a 5-day sample with 1 minute granularity

Conclusion
Based on these findings, the 30-minute EMA is deemed the most suitable. It is important to note that the ETH/USD pair exhibited the lowest volatility among the examined asset pairings.
#cbBTC/USD Price Feed
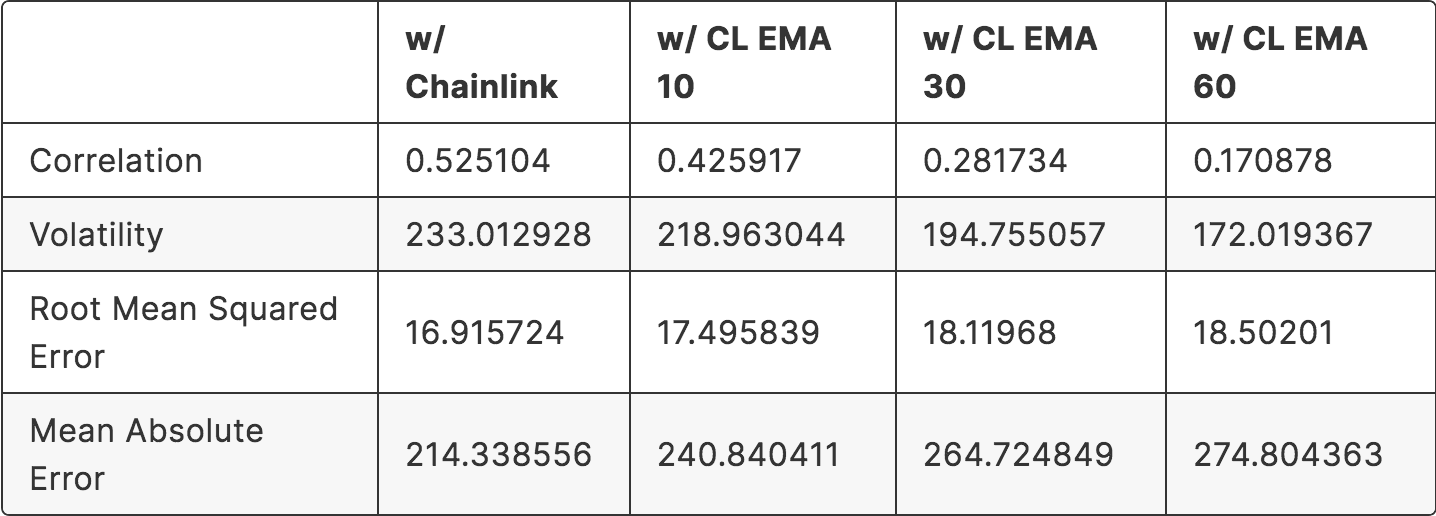
cbBTC/USD Price Feed Timeseries

Oracle Price Feed Latency Distribution
The following latencies were tracked from a 5-day sample with 1 minute granularity

Conclusion
In contrast, the cbBTC/USD pair demonstrated the highest volatility among the analyzed assets. As the subsequent analysis will illustrate, the errors for this pair are excessively high, and the correlation with the spot price is too low to warrant recommending the use of this oracle.
However, if a period must be selected for DeFi.Money, the 10-minute period, or even a shorter period such as 5 minutes, would be recommended. This would at least minimize the already substantial discrepancy between predicted and spot prices and maximize correlation, which should be prioritized in this instance.
#cbETH/USD Price Feed

cbETH/USD Price Feed Timeseries

Oracle Price Feed Latency Distribution
The following latencies were tracked from a 5-day sample with 1 minute granularity

Conclusion
It is important to acknowledge that this pair exhibited only slightly higher volatility than ETH/USD. For reasons similar to those supporting the recommendation of the 30-minute interval for ETH/USD, the 30-minute interval is also recommended for this pair.
However, given that the magnitude of error is nearly twice that observed for ETH/USD, it is suggested that borrowers be incentivized to adopt a relatively more risk-averse approach with this asset pair.
Update: 11/7/24
#wstETH/USD Price Feed*
* This pairing is effectively a "daisy chain" of two oracle feeds: wstETH/ETH and ETH/USD, as a dedicated wstETH/USD Chainlink feed is not available on Base.
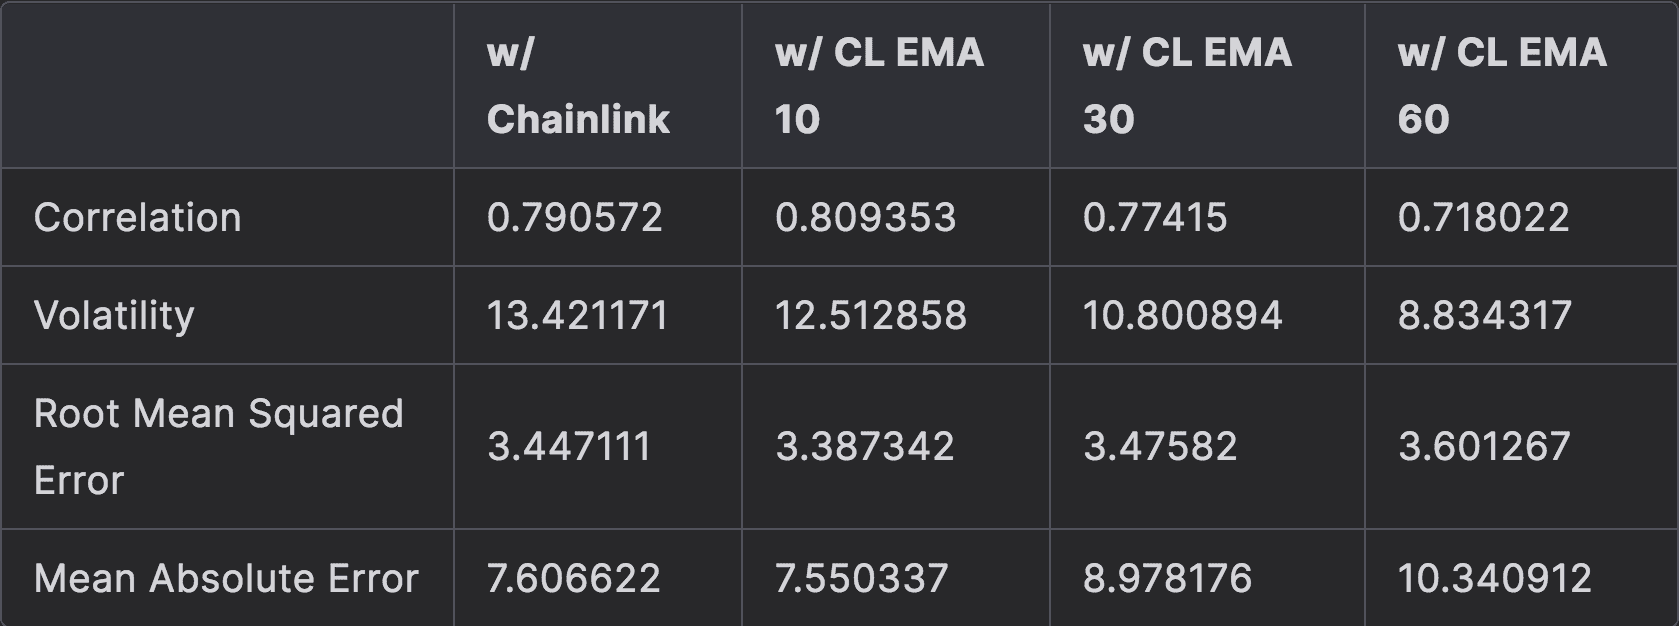
wstETH/USD Price Feed Timeseries

Oracle Price Feed Latency Distribution
The following latencies were tracked from a 5-day sample with 1-minute granularity

Conclusion
A 30-minute EMA is also recommended for this pairing, but for reasons distinct from those applicable to the other ETH derivatives.
Surprisingly, the 10-period EMA exhibited a higher correlation with the spot price and a lower magnitude of error compared to the raw Chainlink feed, a phenomenon not observed in the previous analyses. Therefore, there is concern that the 10-minute EMA period may still be excessively volatile, and a 30-minute period is deemed more appropriate.
#Appendix: Simulation Data Analysis
Below, we present the analysis of simulation data that motivates the choice of the parameters presented in the above table.
#A.1 WETH Market
#Liquidation Discount vs. Sensitivity (Fixed A Factor): Bad Debt
WETH relative to the borrowed asset seems to have a proportionally higher liquidity profile. The liquidator seems to be able to liquidate under no liquidation constraints. This means that a larger portion of the debt can be auctioned, resulting from higher liquidation discounts, and the market is able to absorb them, resulting in higher ranges being safer.
Hence we begin our analysis with a liquidation discount of 0.07 as a viable liquidation discount. Subsequent heat maps test at progressively higher liquidation discounts.
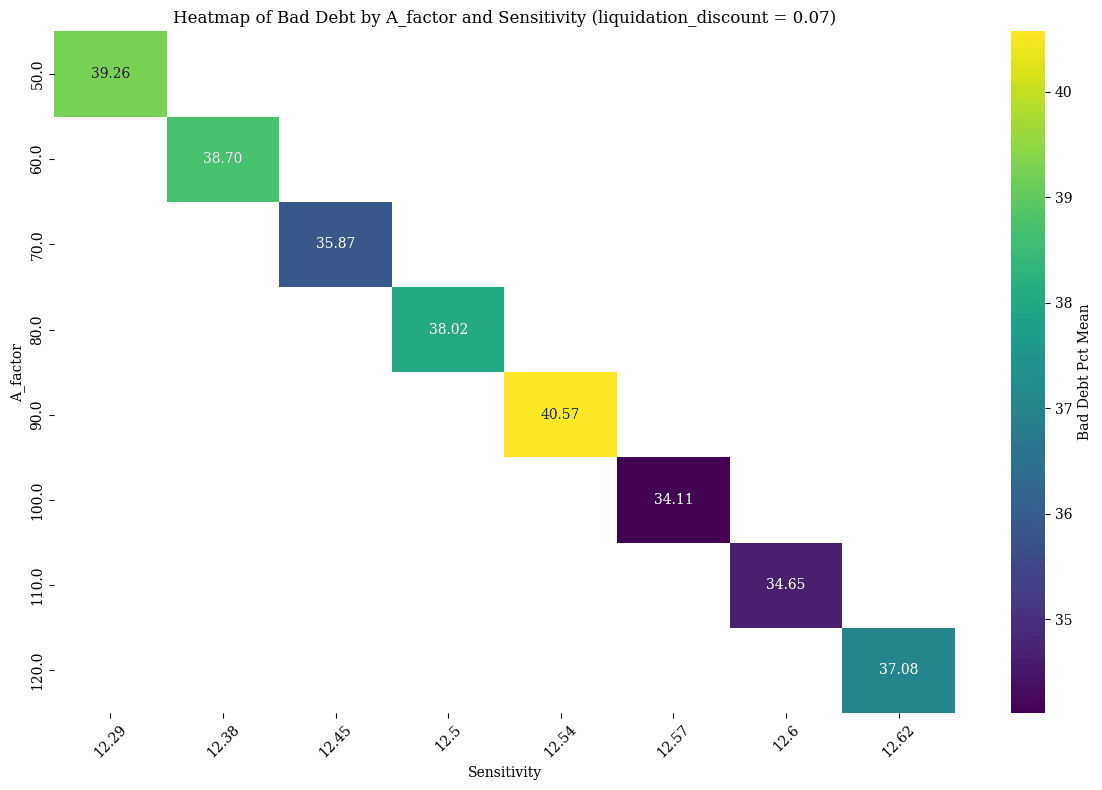
Performance range Liquidation Discount 0.07:
- A_factor 100 to 110
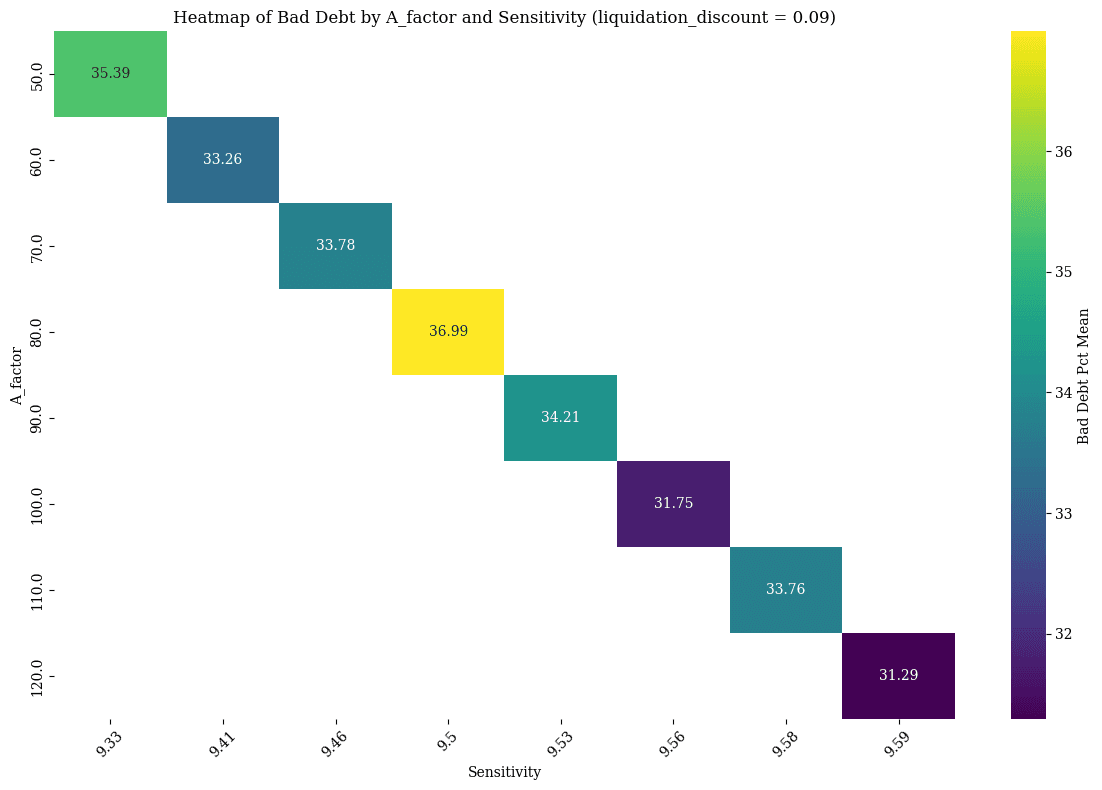
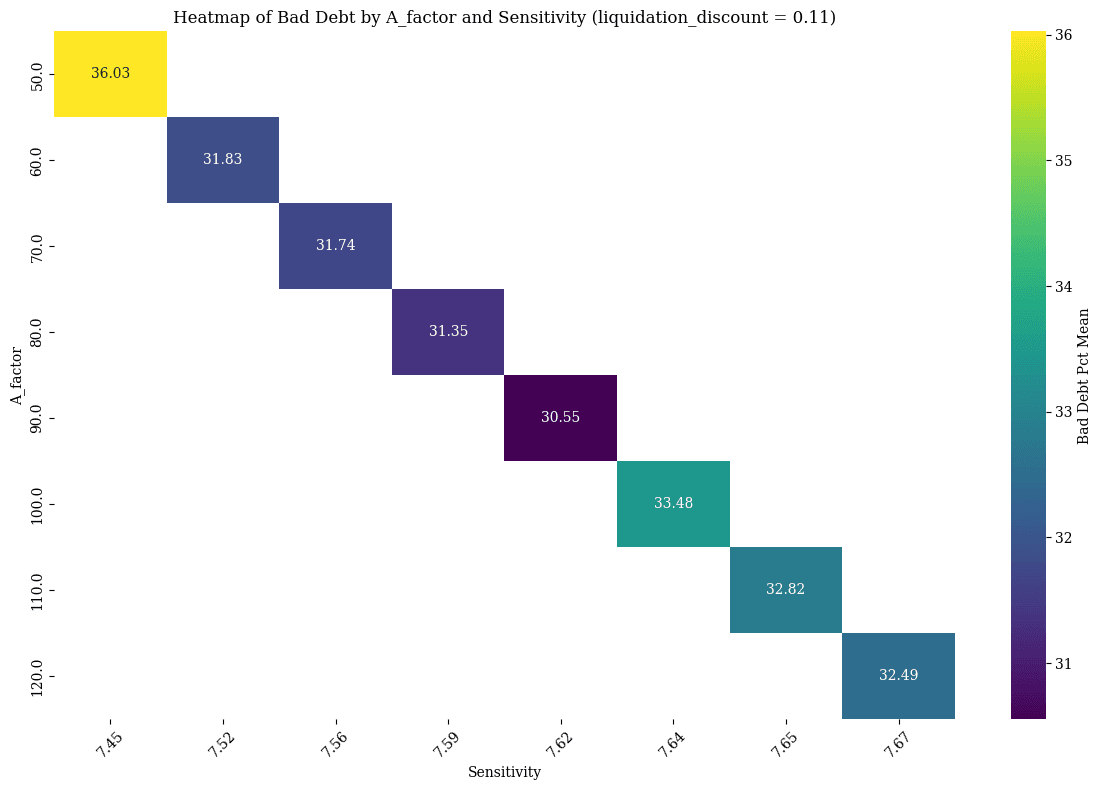
Performance range Liquidation Discount 0.09:
-
A_factor 60 to 70 and
-
A_factor 90 to 120
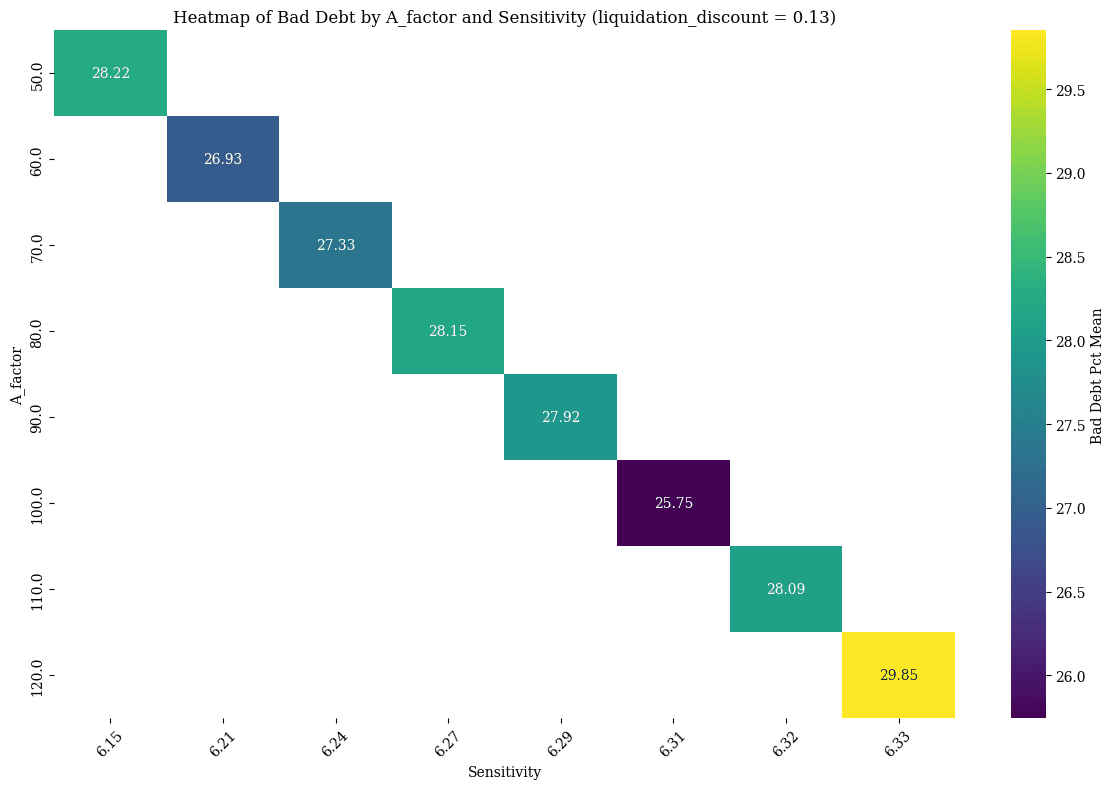
Performance range Liquidation Discount 0.11:
- A_factor 60 to 90
Performance range Liquidation Discount 0.13:
- A_factor 50 to 100
We stop the analysis here, as by referencing the profit chart, higher values become less optimal.
#A Factor vs. Liquidation Discount: Expected Net Llamma Profit
#Fee vs. Liquidation Discount (Fixed A): Net Borrow Loss
In the following tables we have tested borrower losses according to various A_factor and AMM fee values.
#Liquidation Discount 0.07 | A_factor 100 to 110
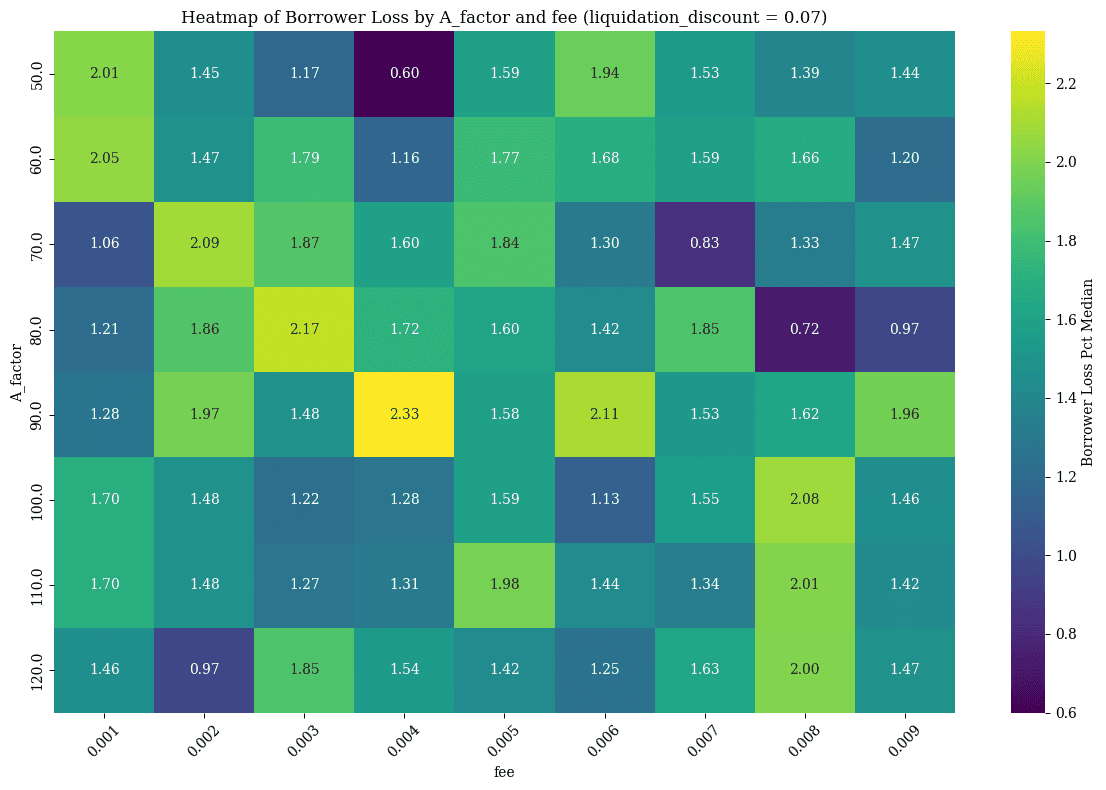
Fee: 0.002 to 0.004
#Liquidation Discount 0.09 | 60 to 70 and 100 to 120
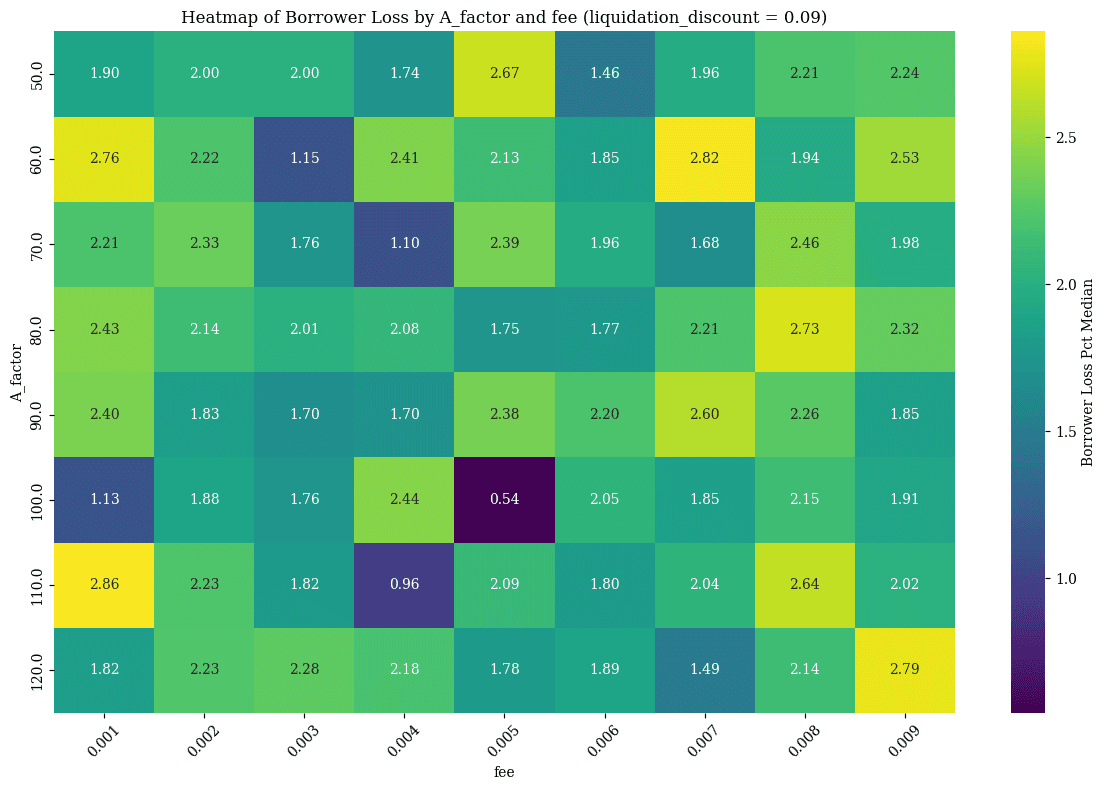
Fee: 0.002 to 0.004
#Liquidation Discount 0.11 | A_factor 60 to 90
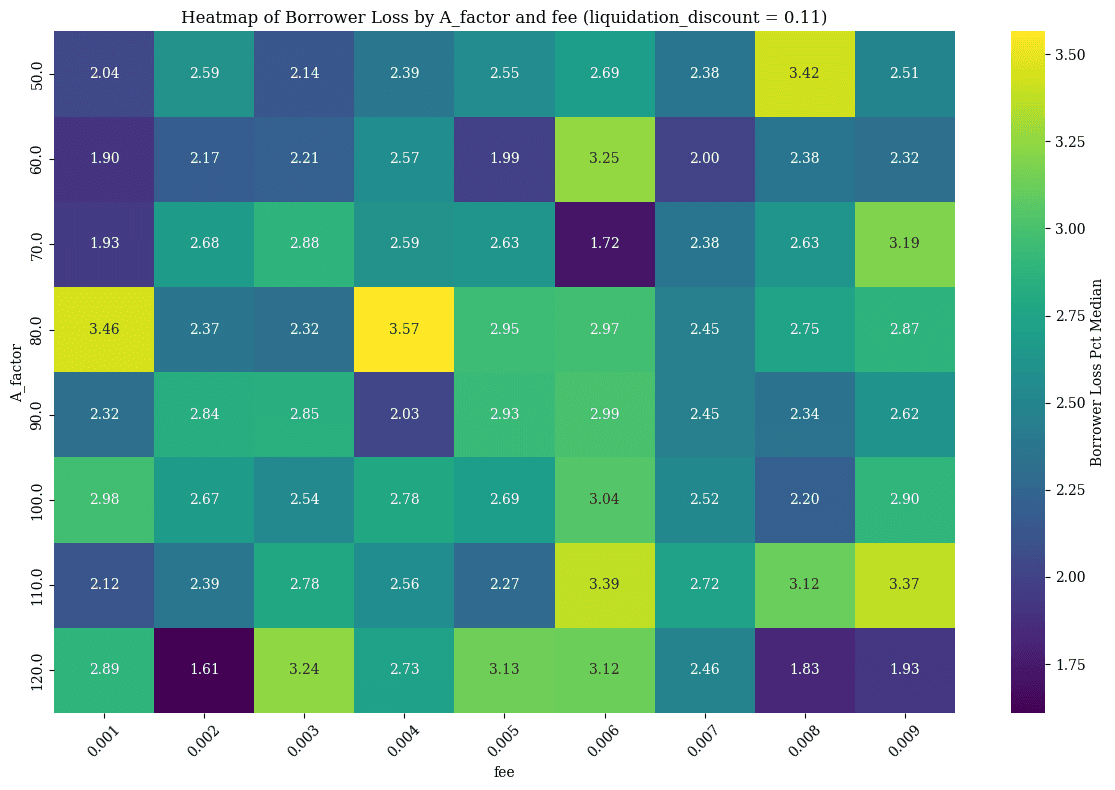
Fee: 0.003
#Liquidation Discount 0.13 | 50 to 100
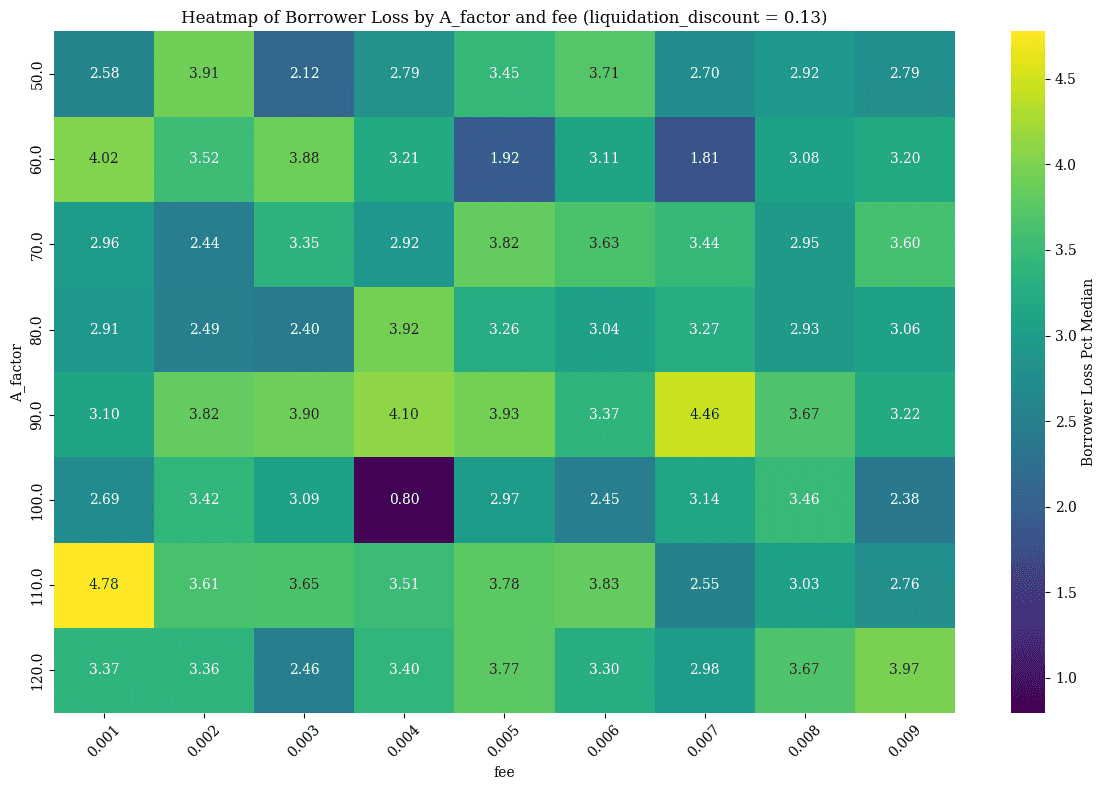
Hard to see a clear pattern Fee: 0.002 - 0.003 (by focusing on narrow ranges)
#A.2 cbBTC Market
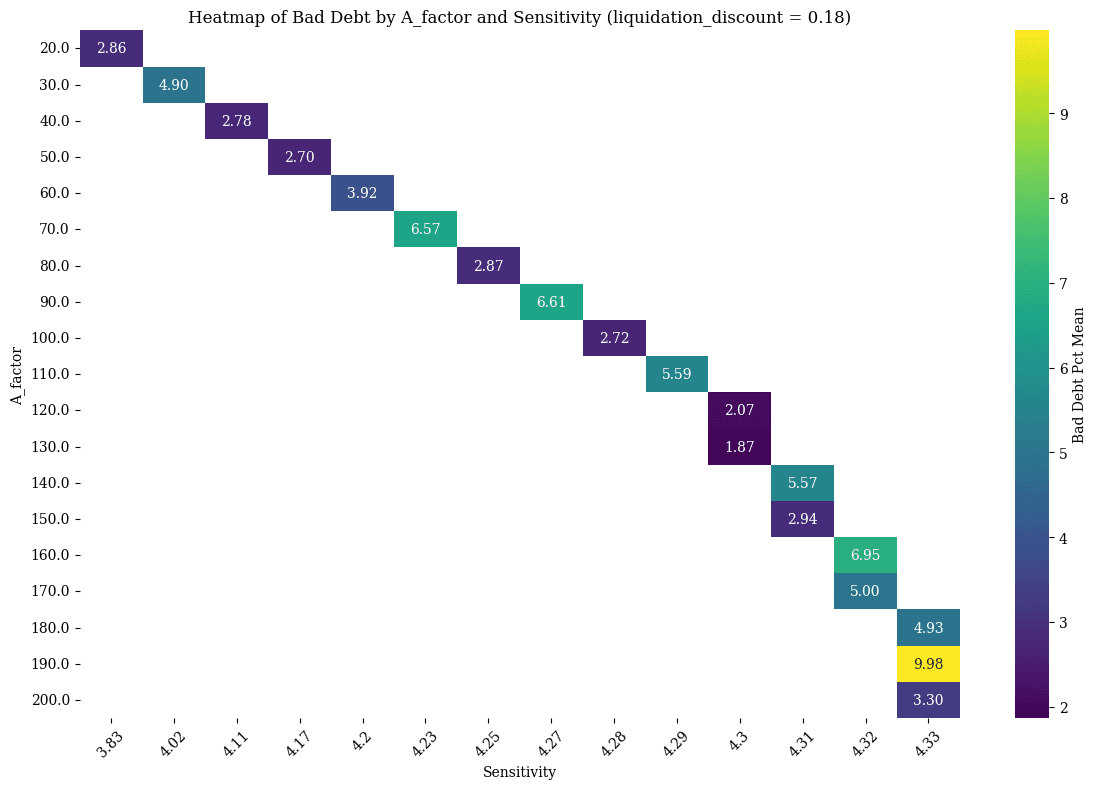
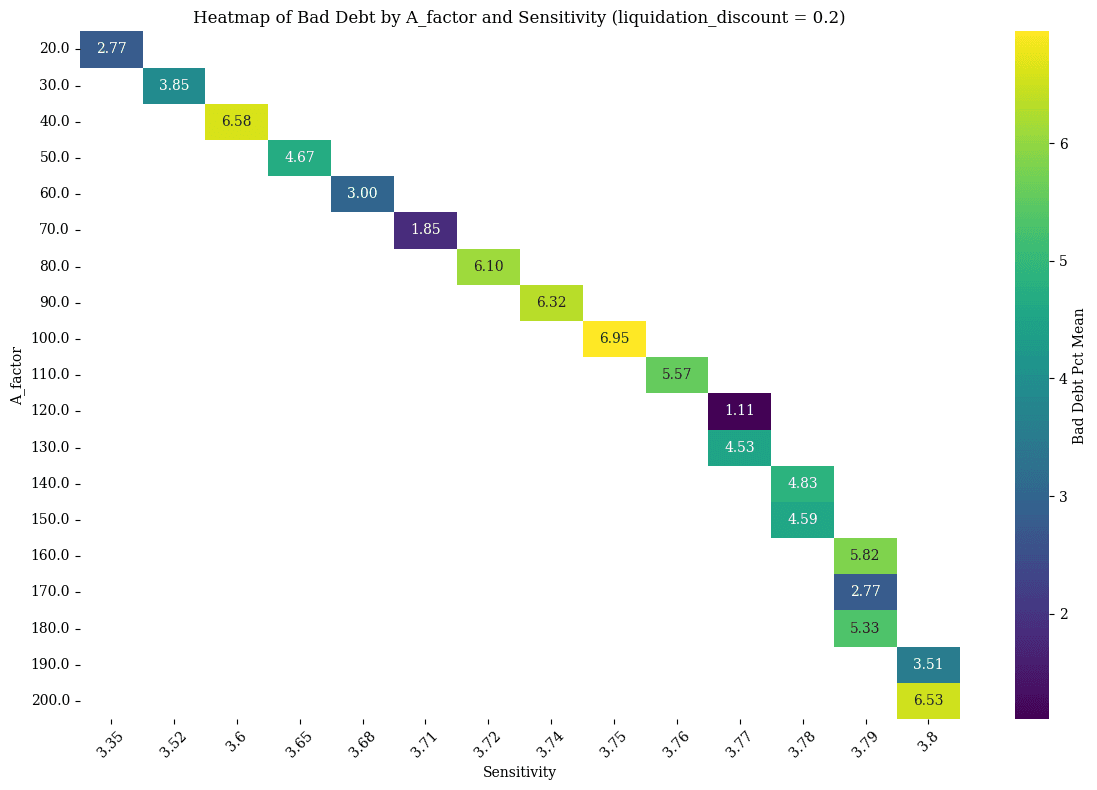
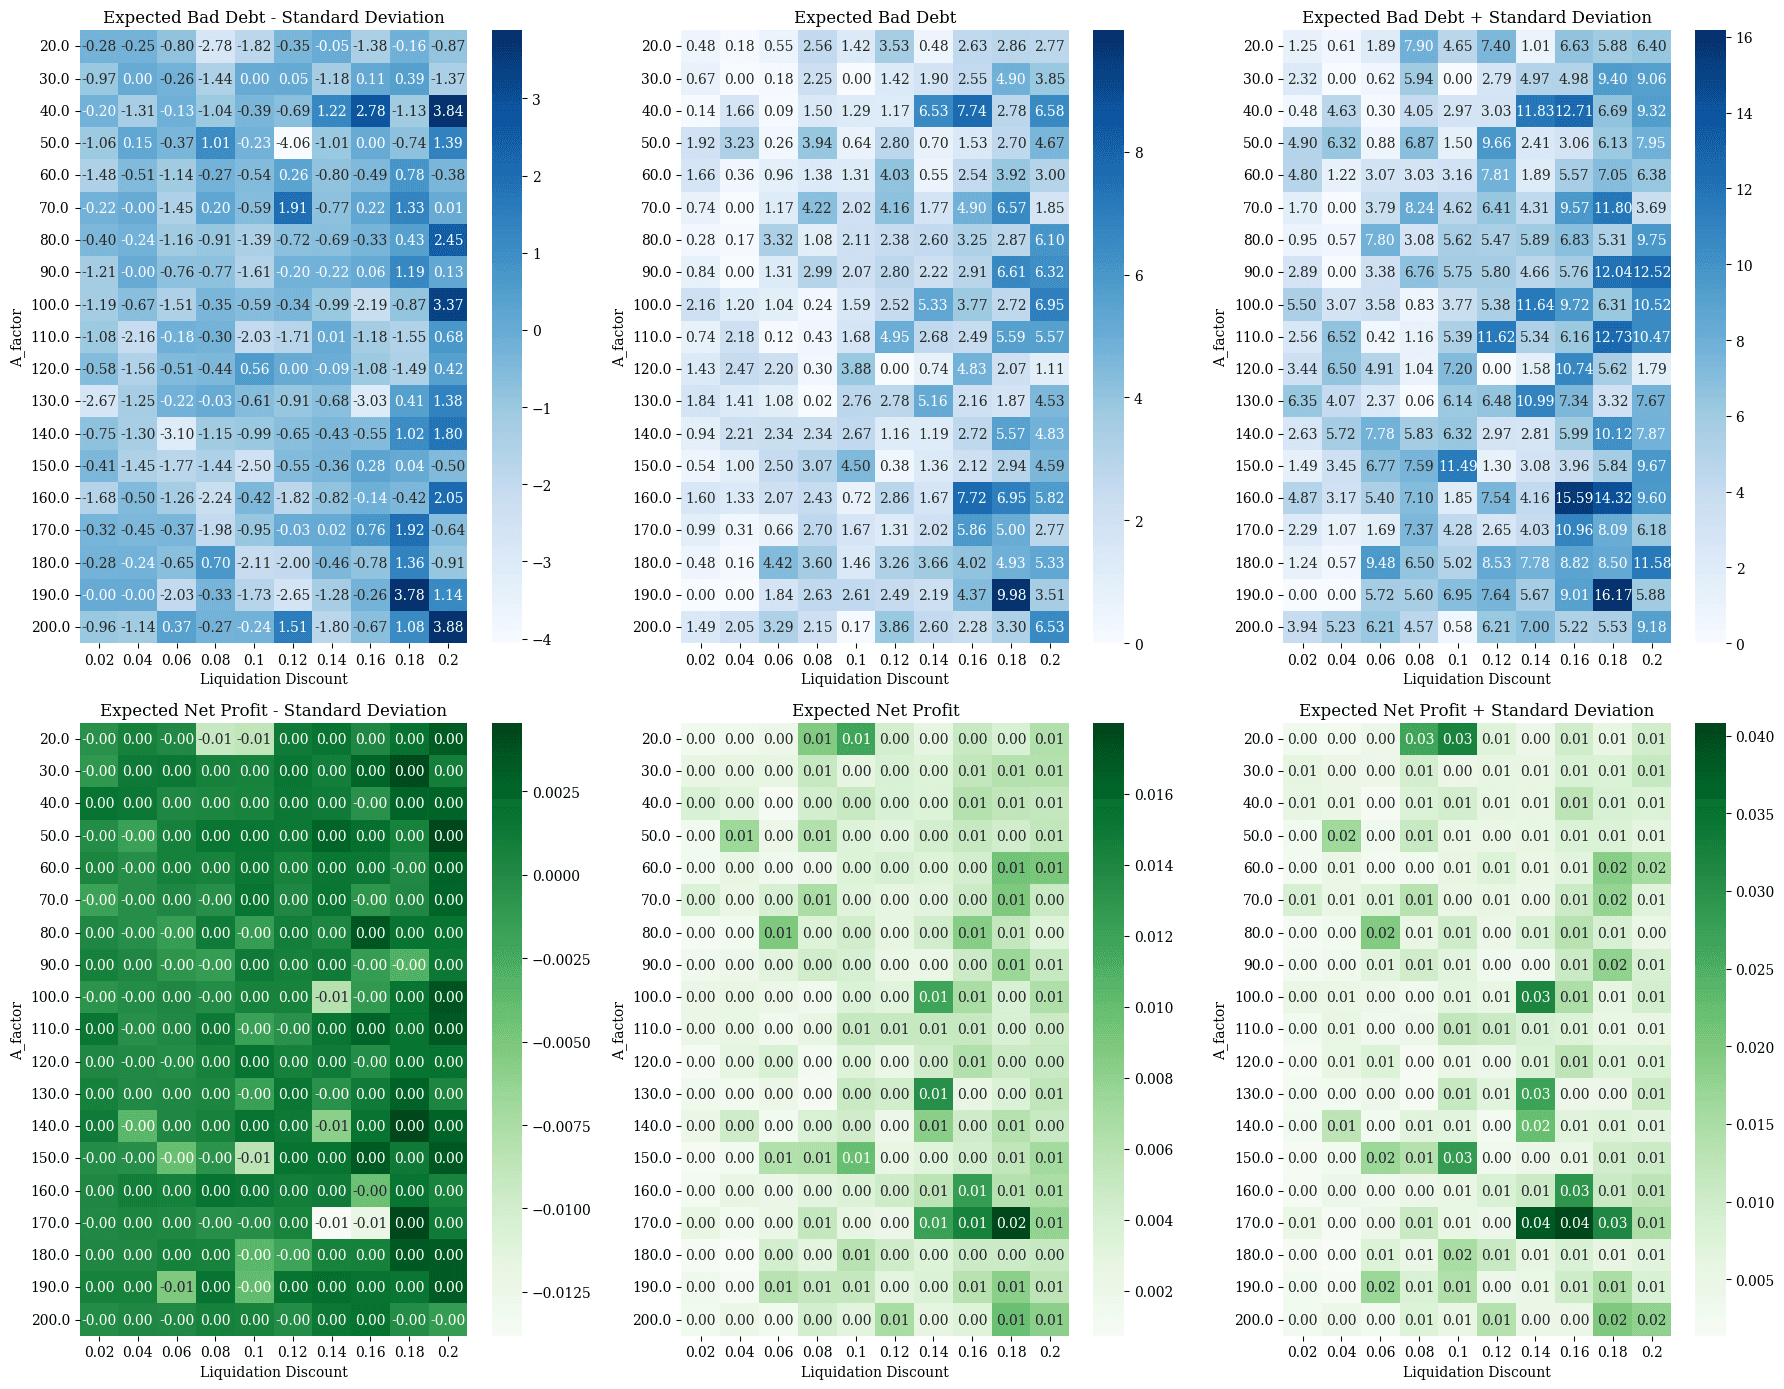
We run the cbBTC Market Experiment and retrieved the following charts.
#Liquidation Discount vs. Sensitivity (Fixed A Factor): Bad Debt
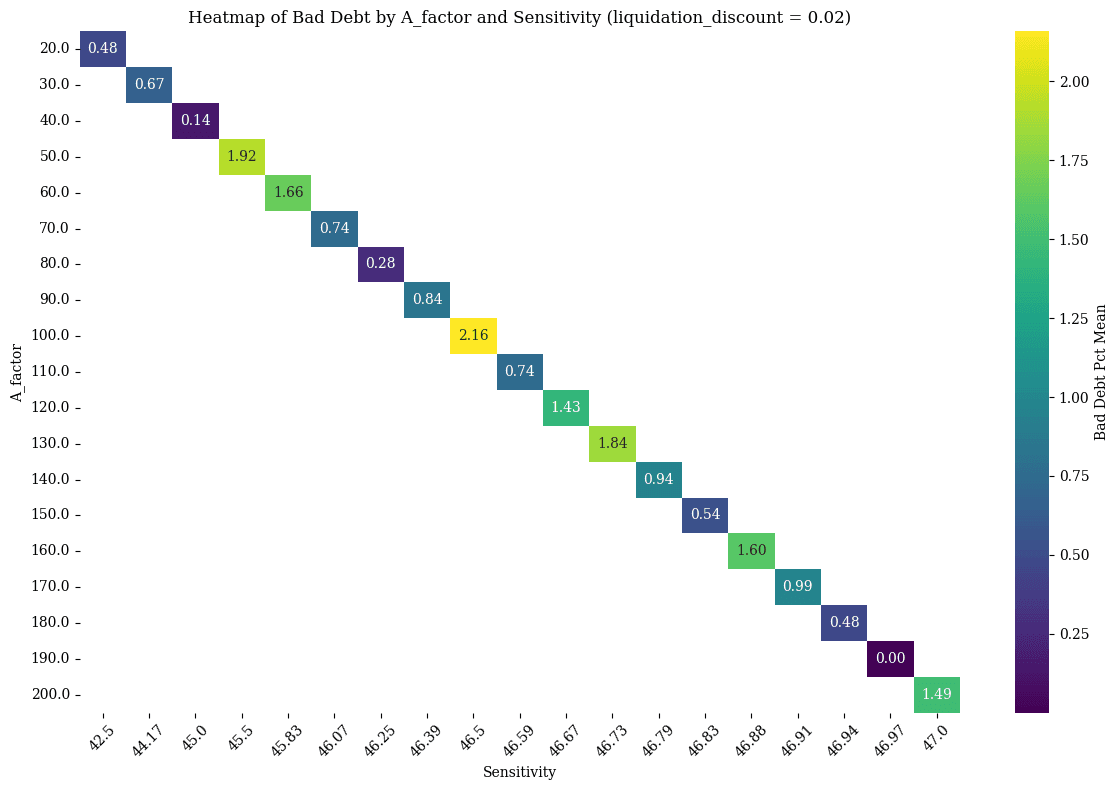
Insufficient trend
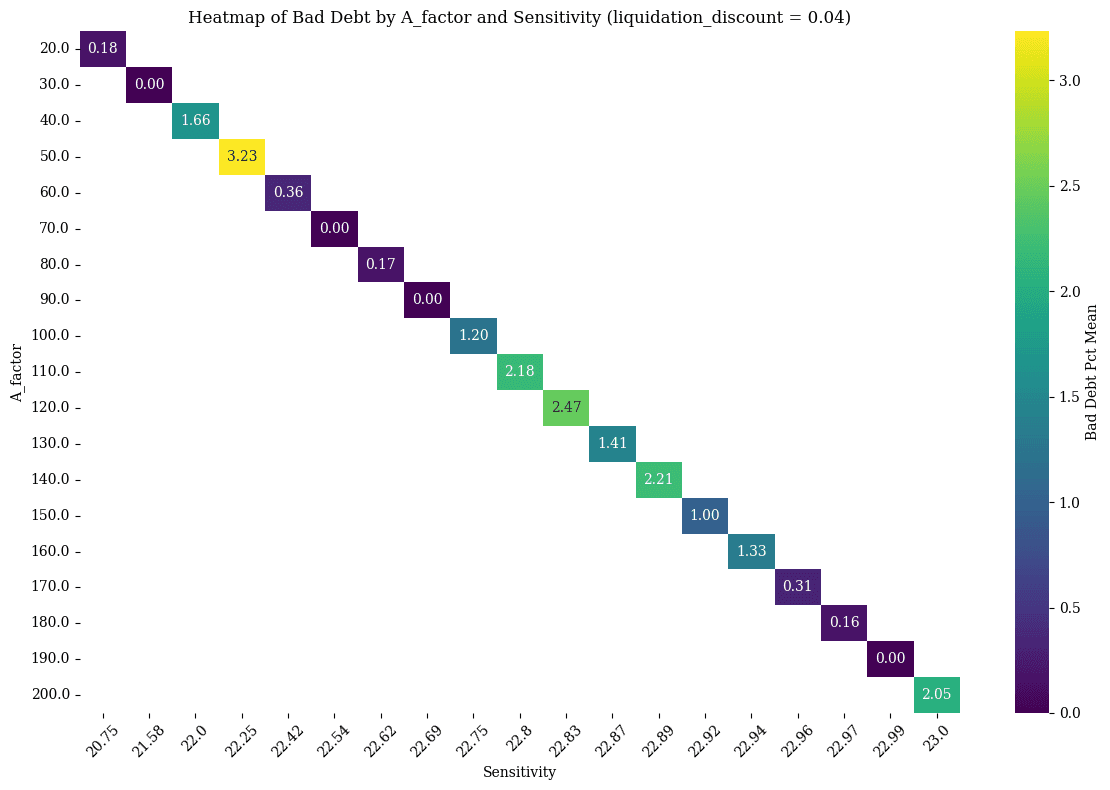
60 to 90
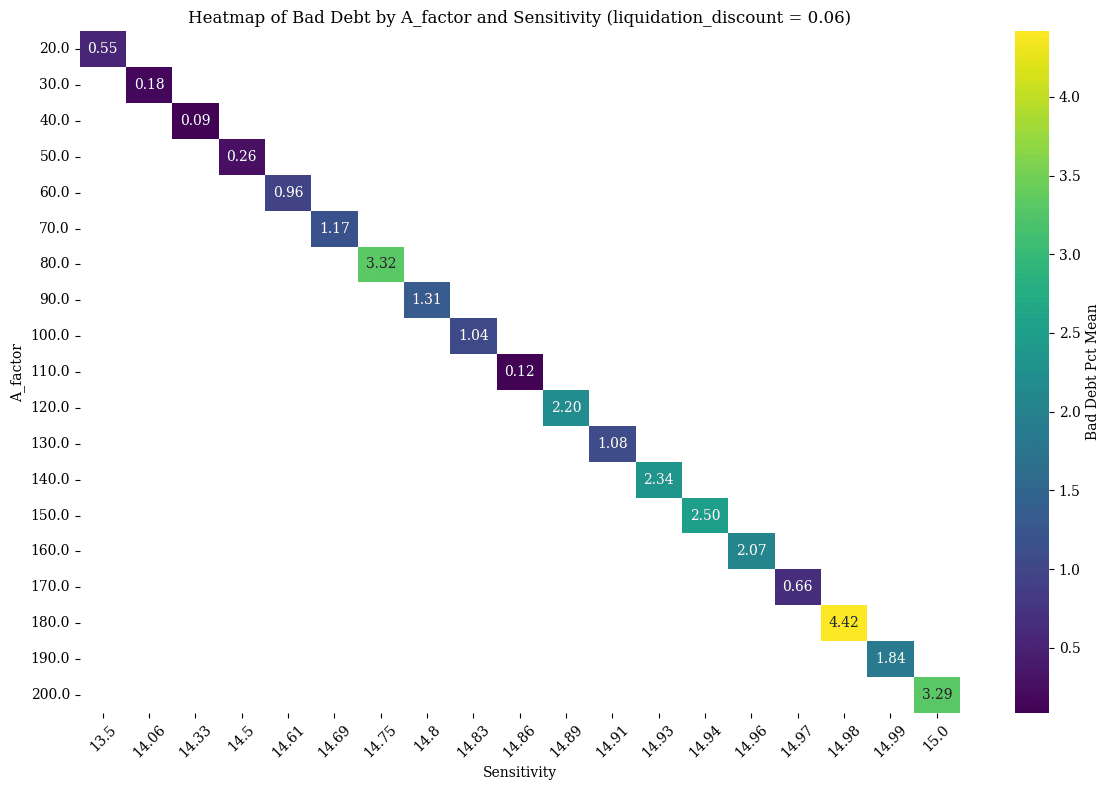
20 to 50
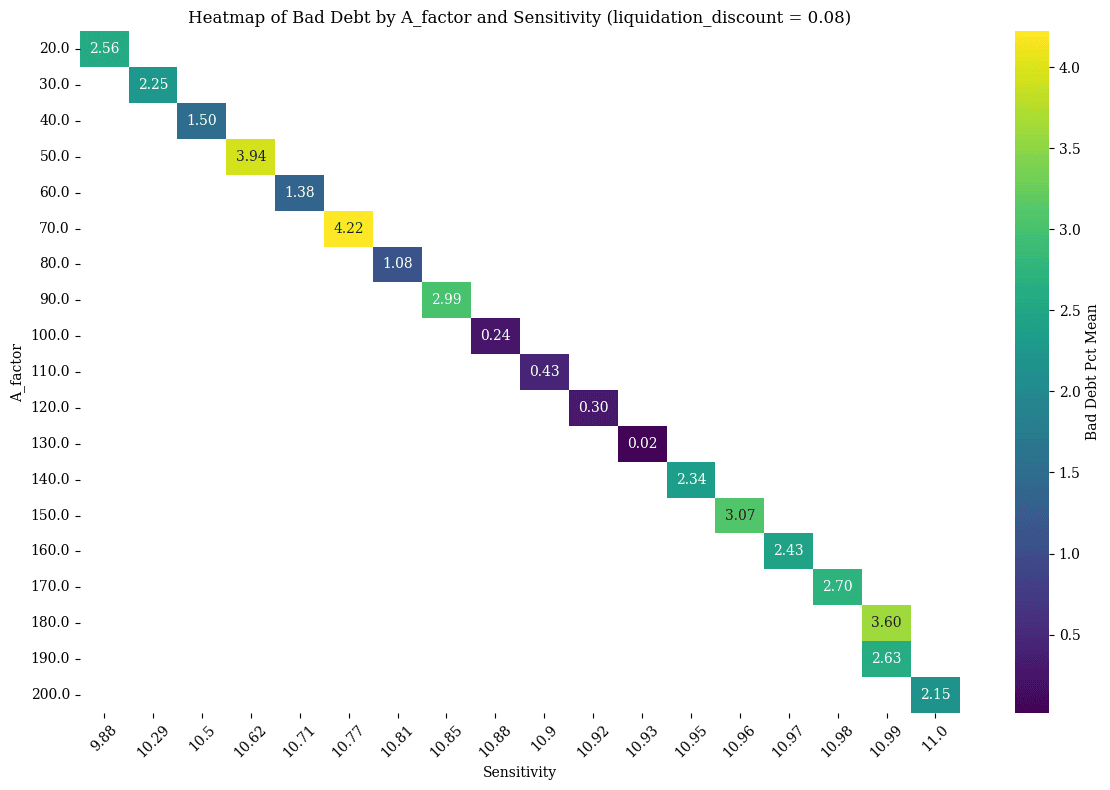
90 to 130
N/A, onwards
#A Factor vs. Liquidation Discount: Expected Net Llamma Profit
#Fee vs. Liquidation Discount (Fixed A): Net Borrow Loss
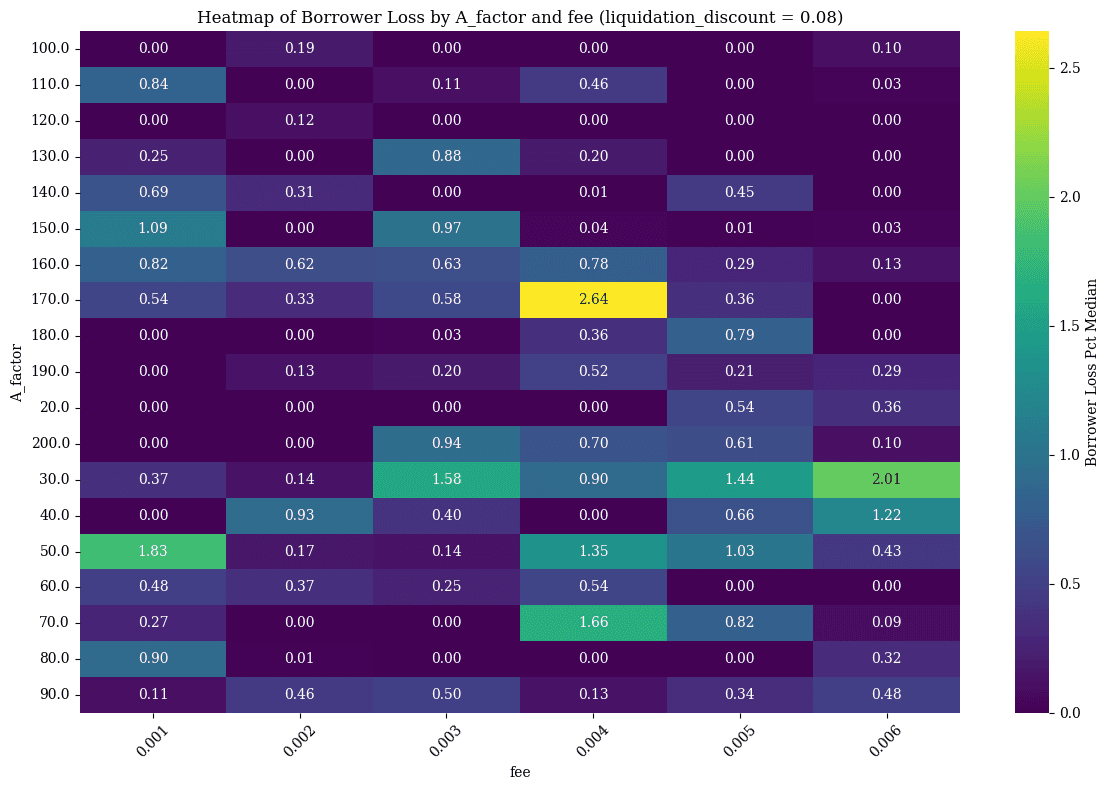
#liquidation_discount 0.04 | A Factor Range 60 to 90
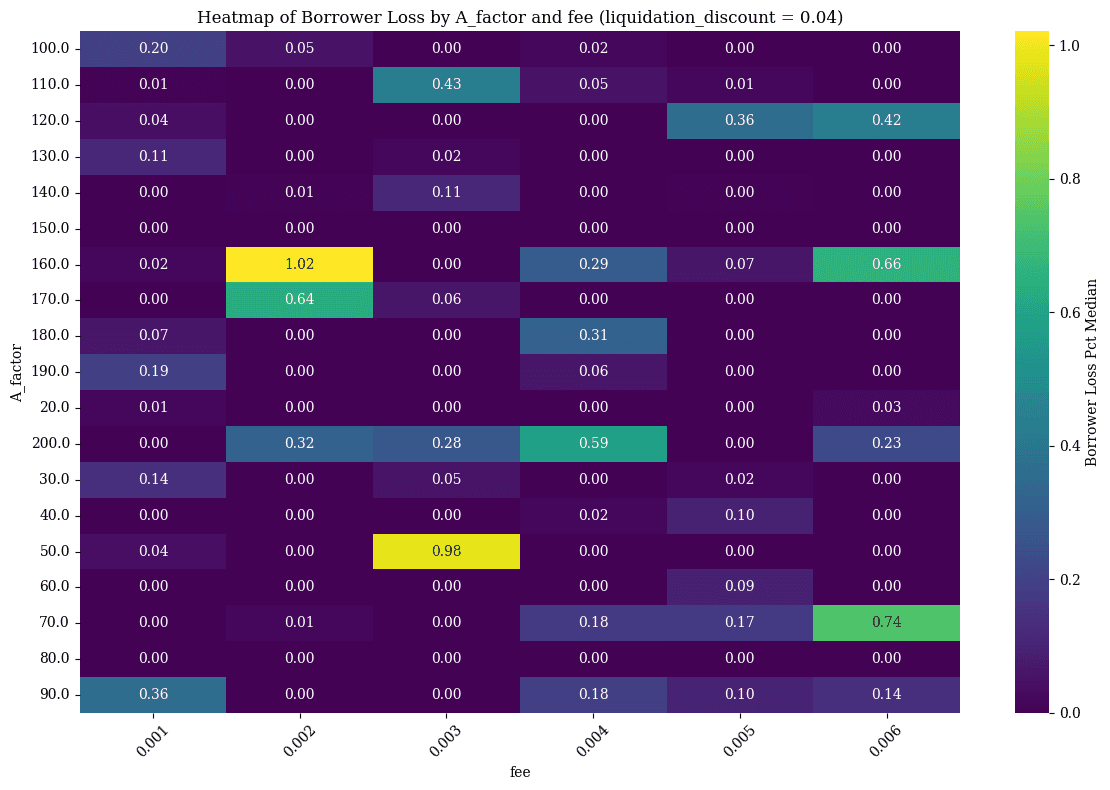
Fee 0.001
#liquidation_discount 0.06 | A Factor Range 140 to 160
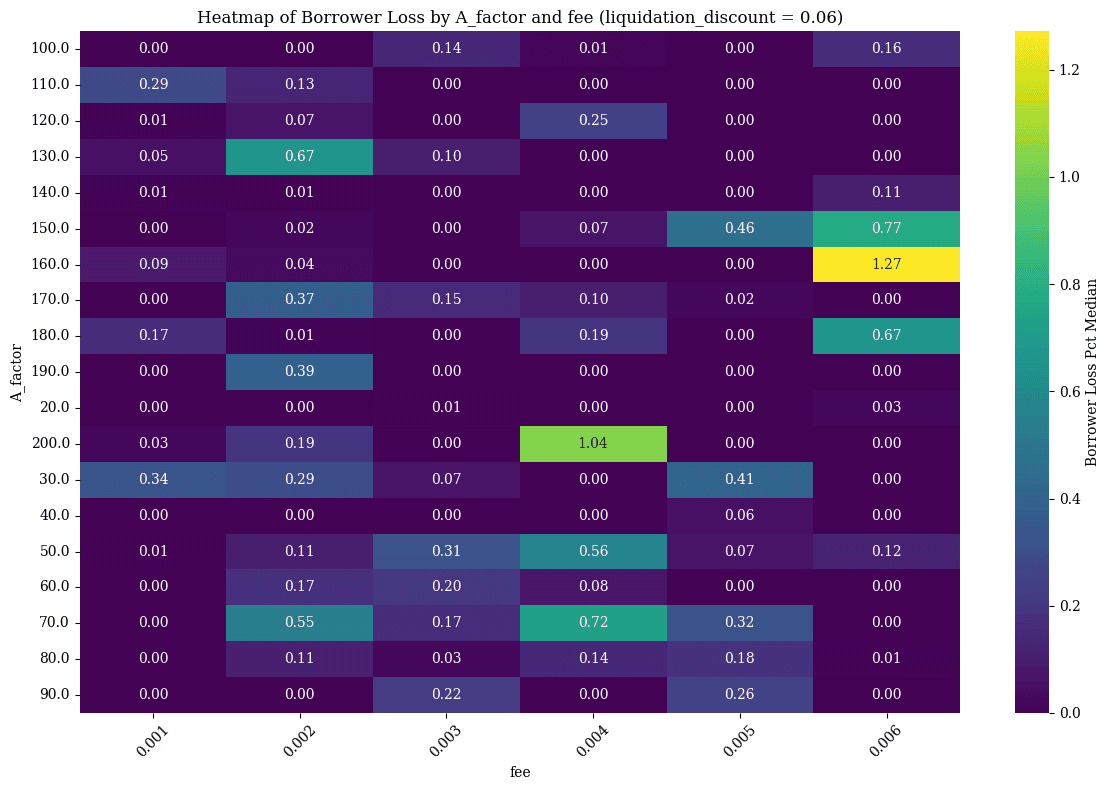
Fee 0.002 to 0.003
#liquidation_discount 0.08 | A Factor Range 60 to 70
#A.3 cbETH Market
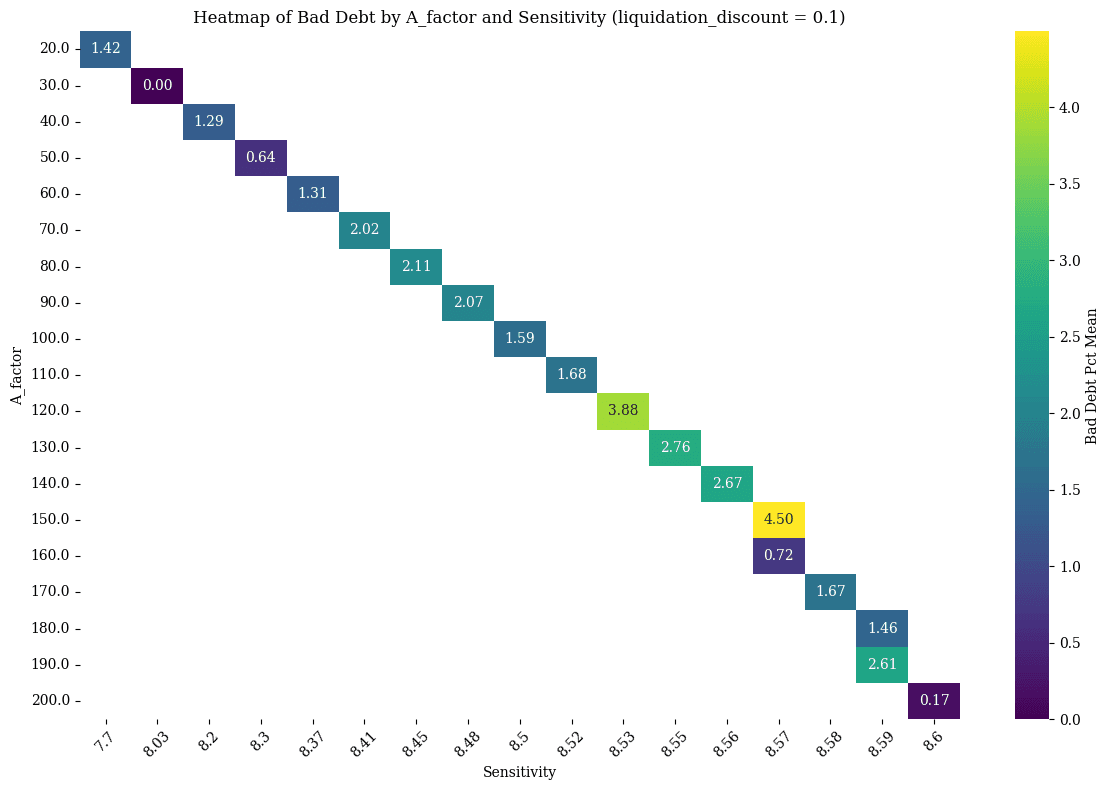
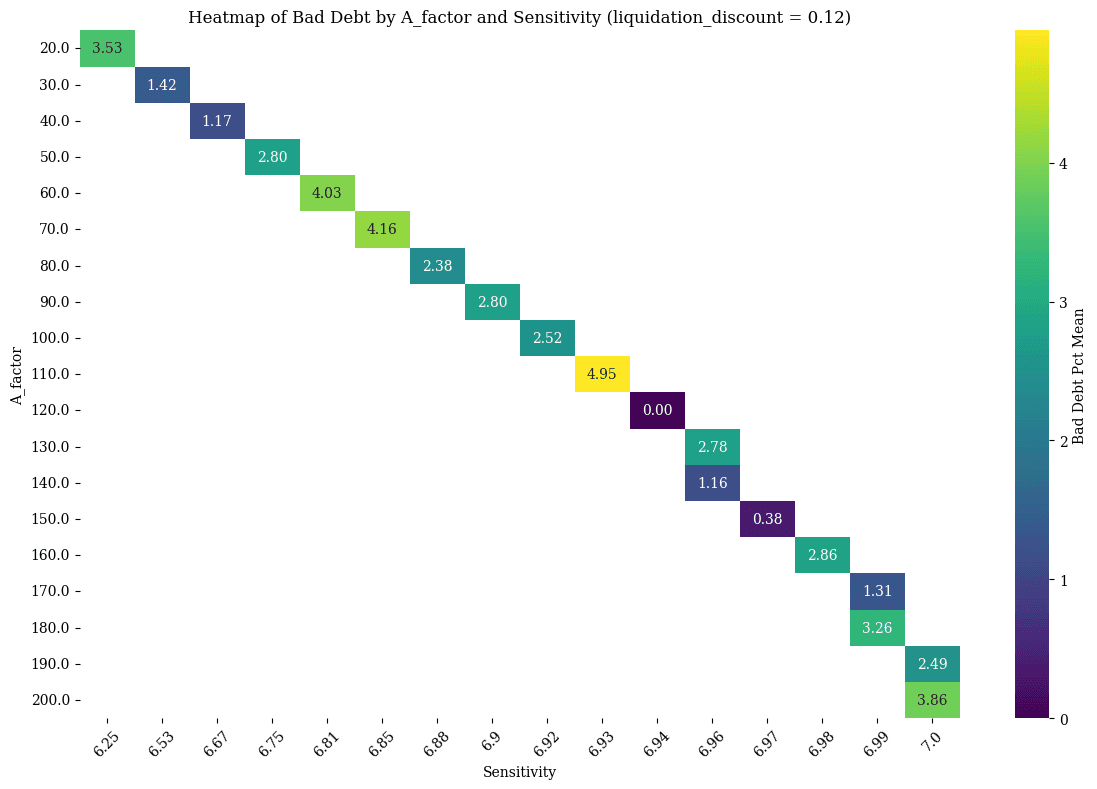
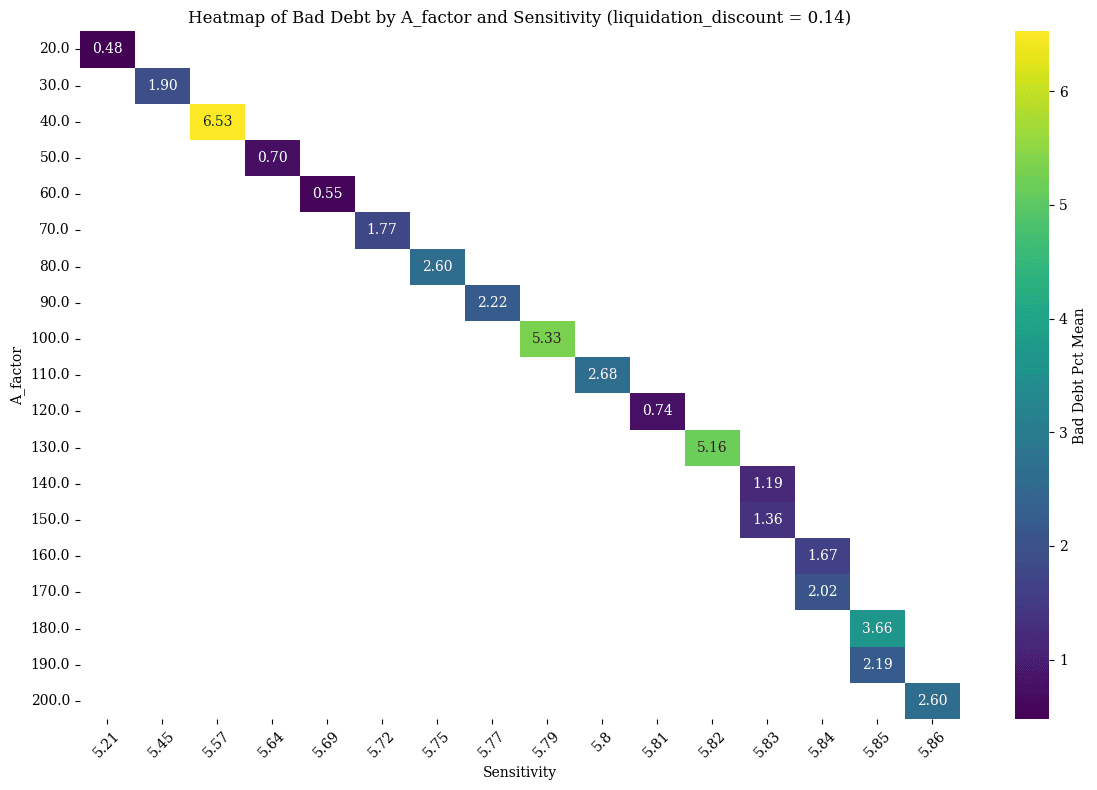
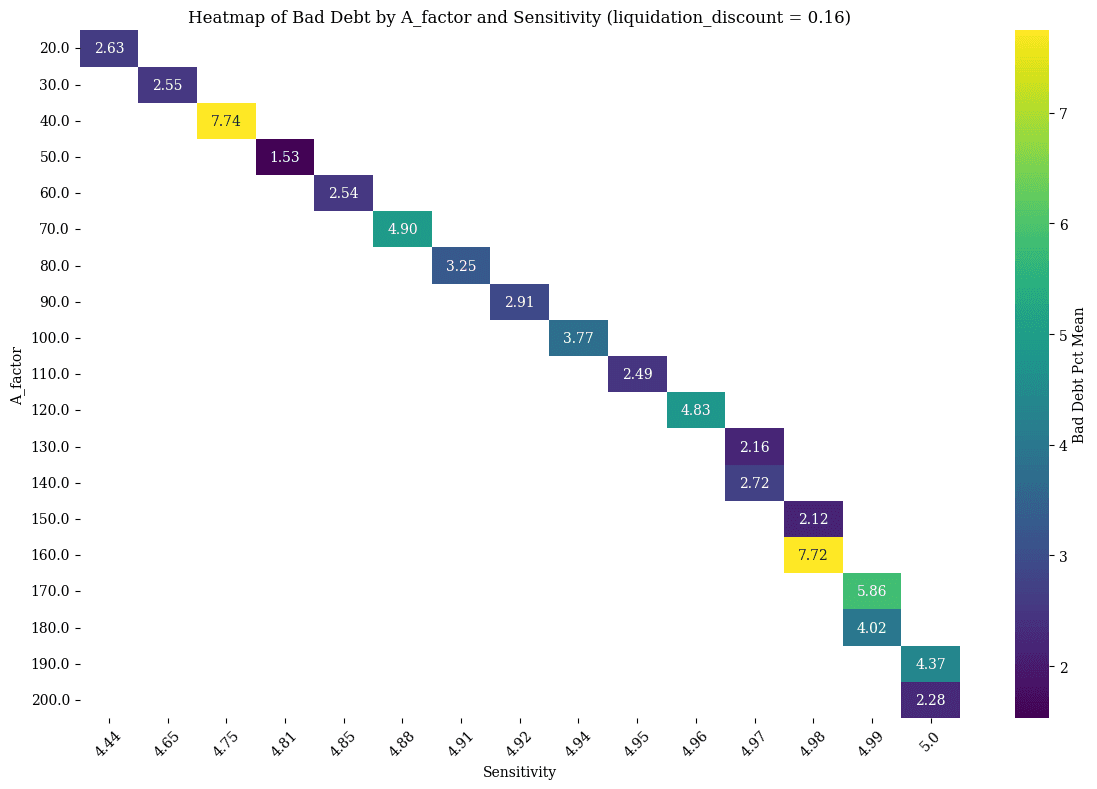
#Liquidation Discount vs. Sensitivity (Fixed A Factor): Bad Debt
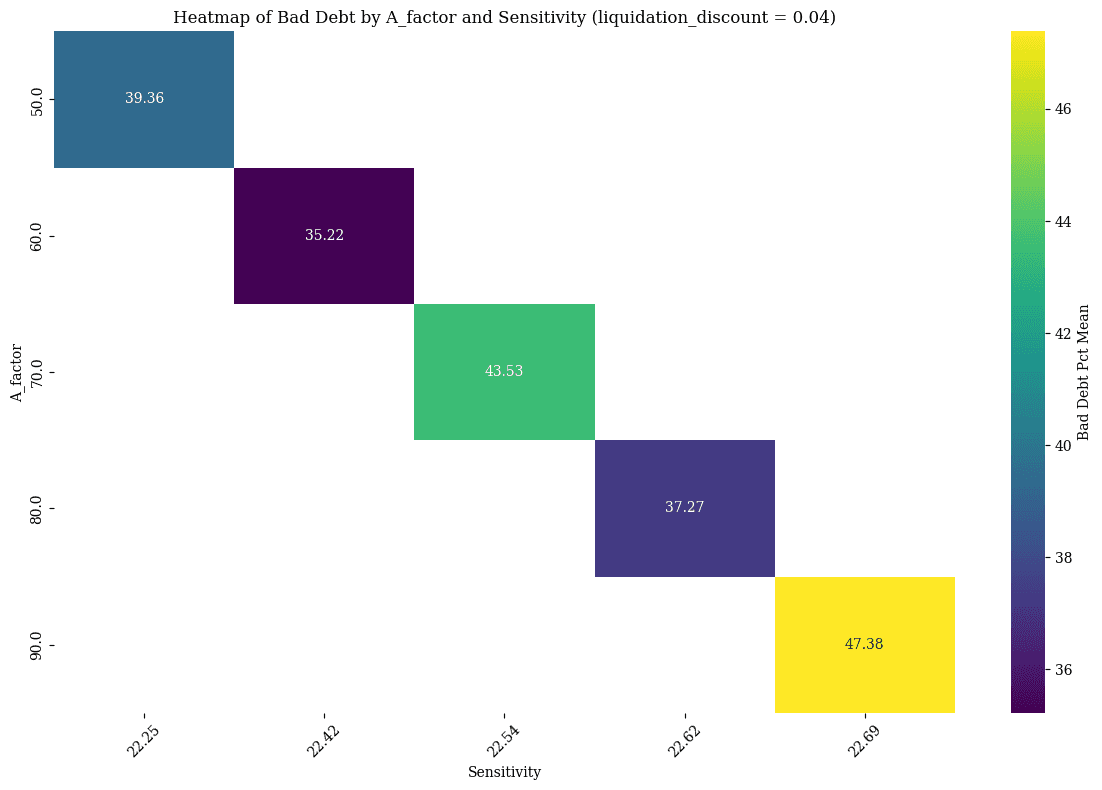
A promising trend is somewhat unclear - potentially 50 to 60 seem viable in this chart.
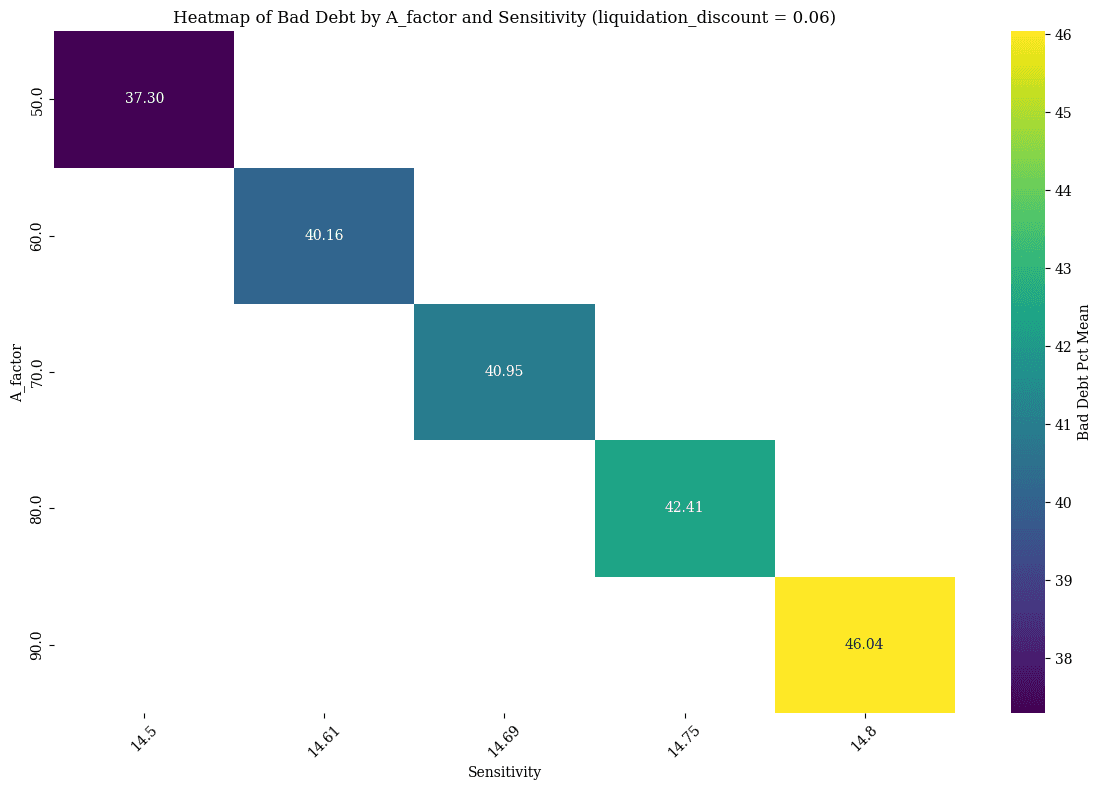
We see for liquidation discount 0.06 a gradual trend as sensitivity increases. A suitable range may be 50 to 60.
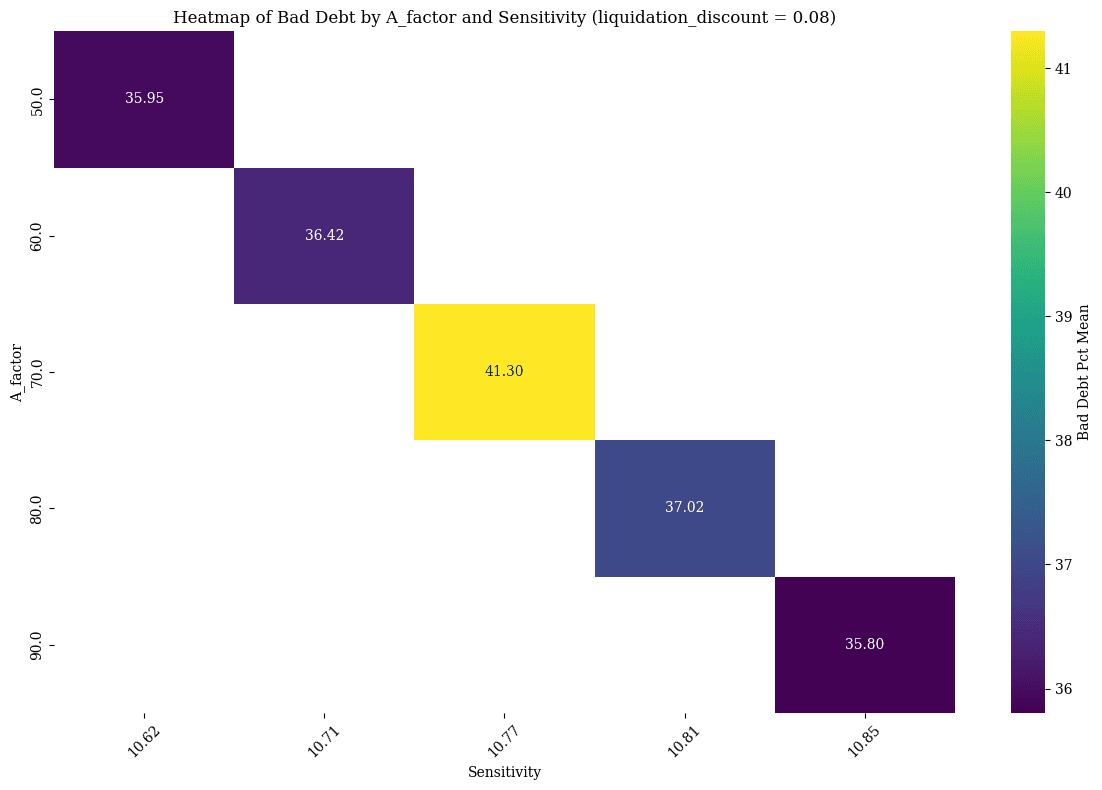
We see for liquidation discount 0.08 a viable trend for 50 to 60 and 80 to 90.
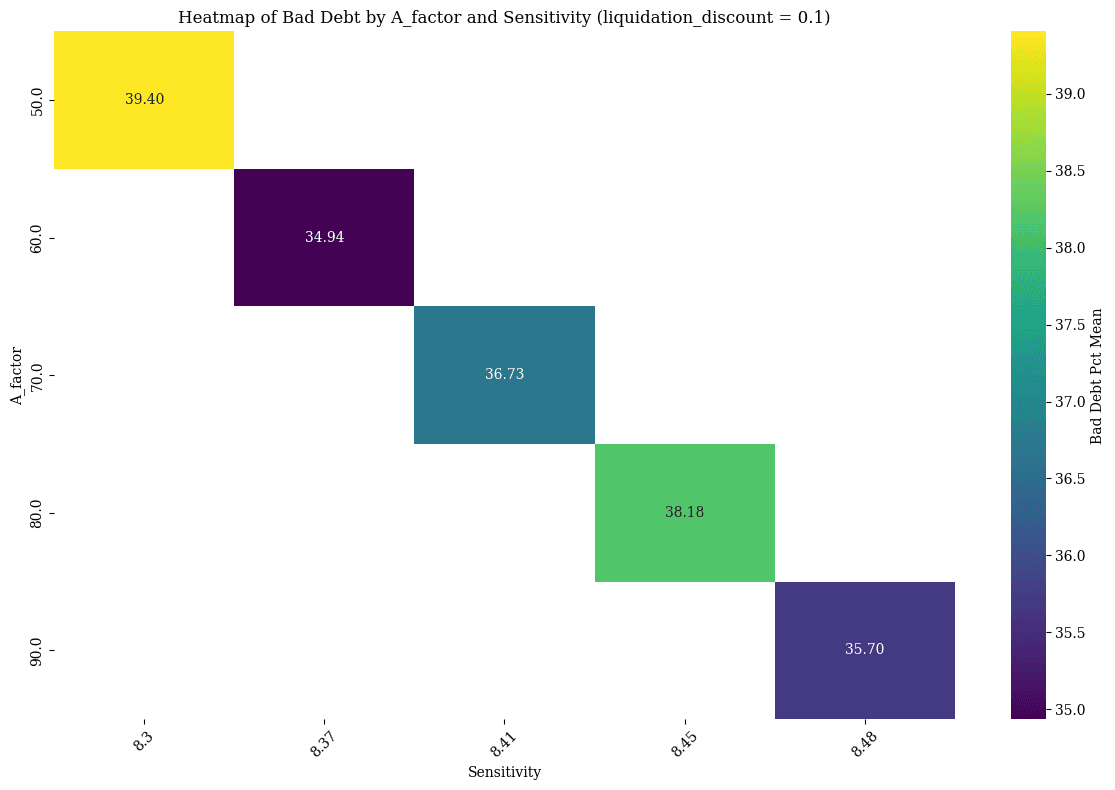
A viable liquidation discount may be 0.1 for A factor 60 to 70.
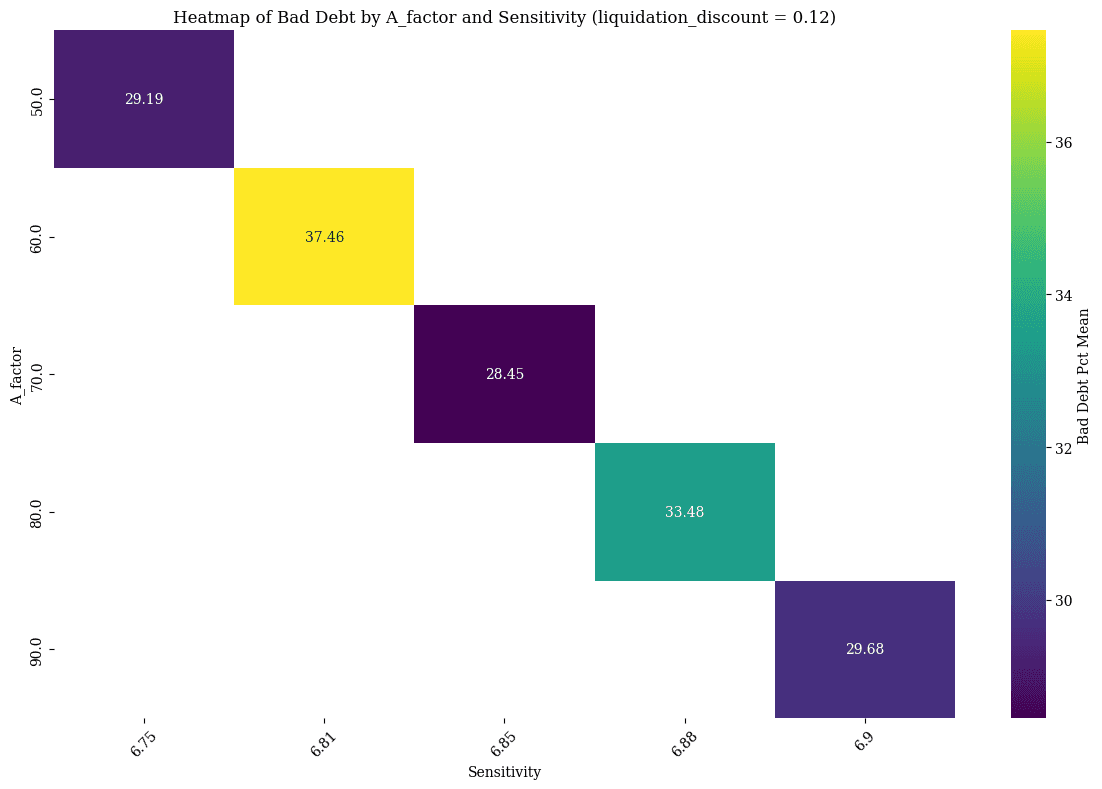
For liquidation_discount 0.12 seems less viable to identify a clear trend.
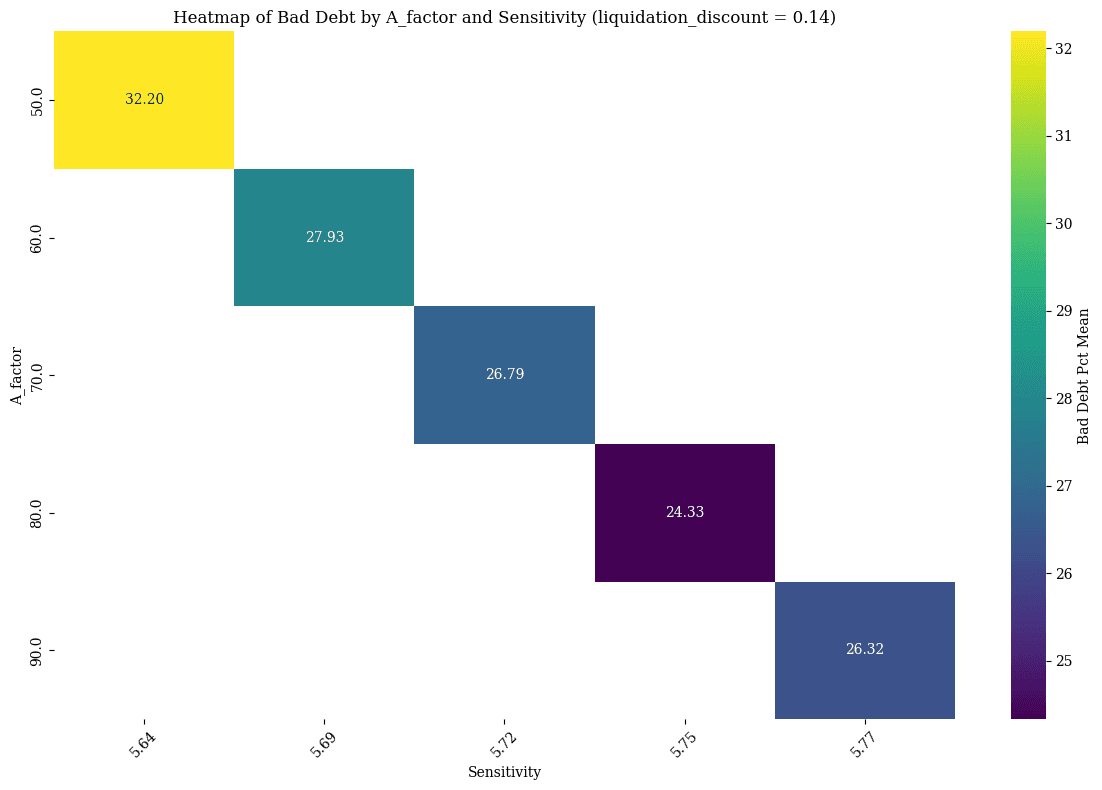
For liquidation_discount 0.14 a suitable range lies between 70 to 90.
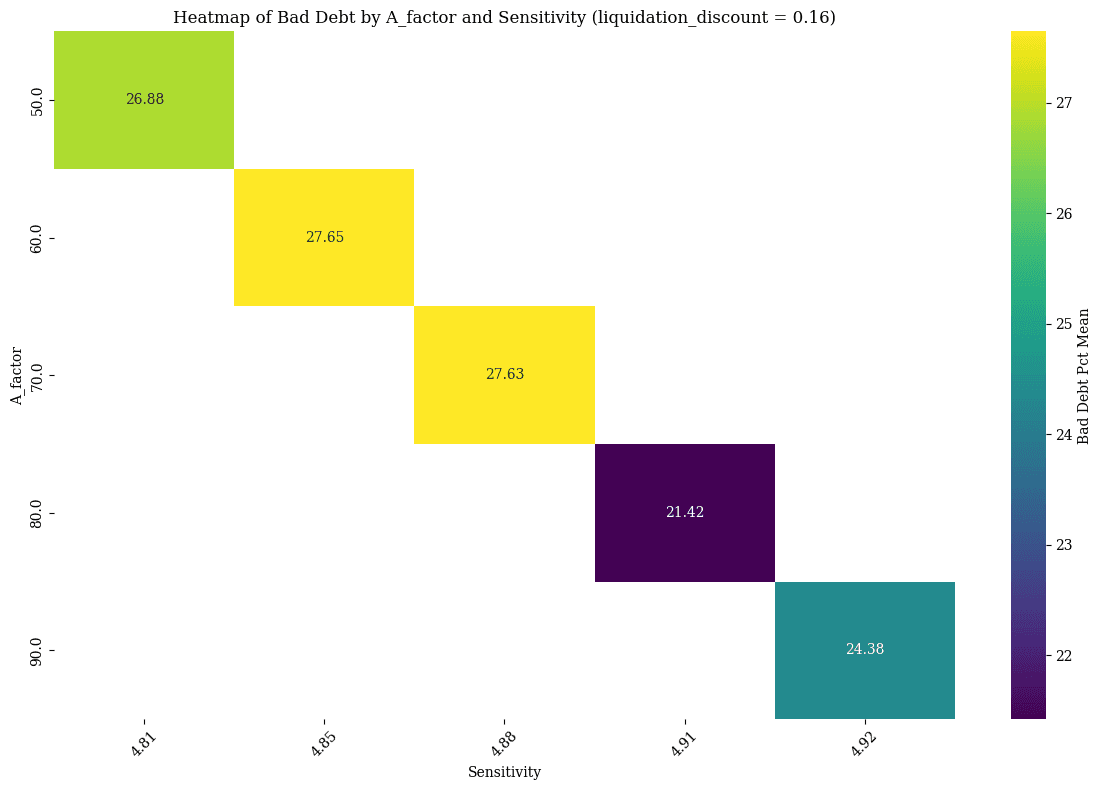
For liquidation_discount 0.16 a suitable range lies between 80 to 90.
#A Factor vs. Liquidation Discount: Expected Net Llamma Profit
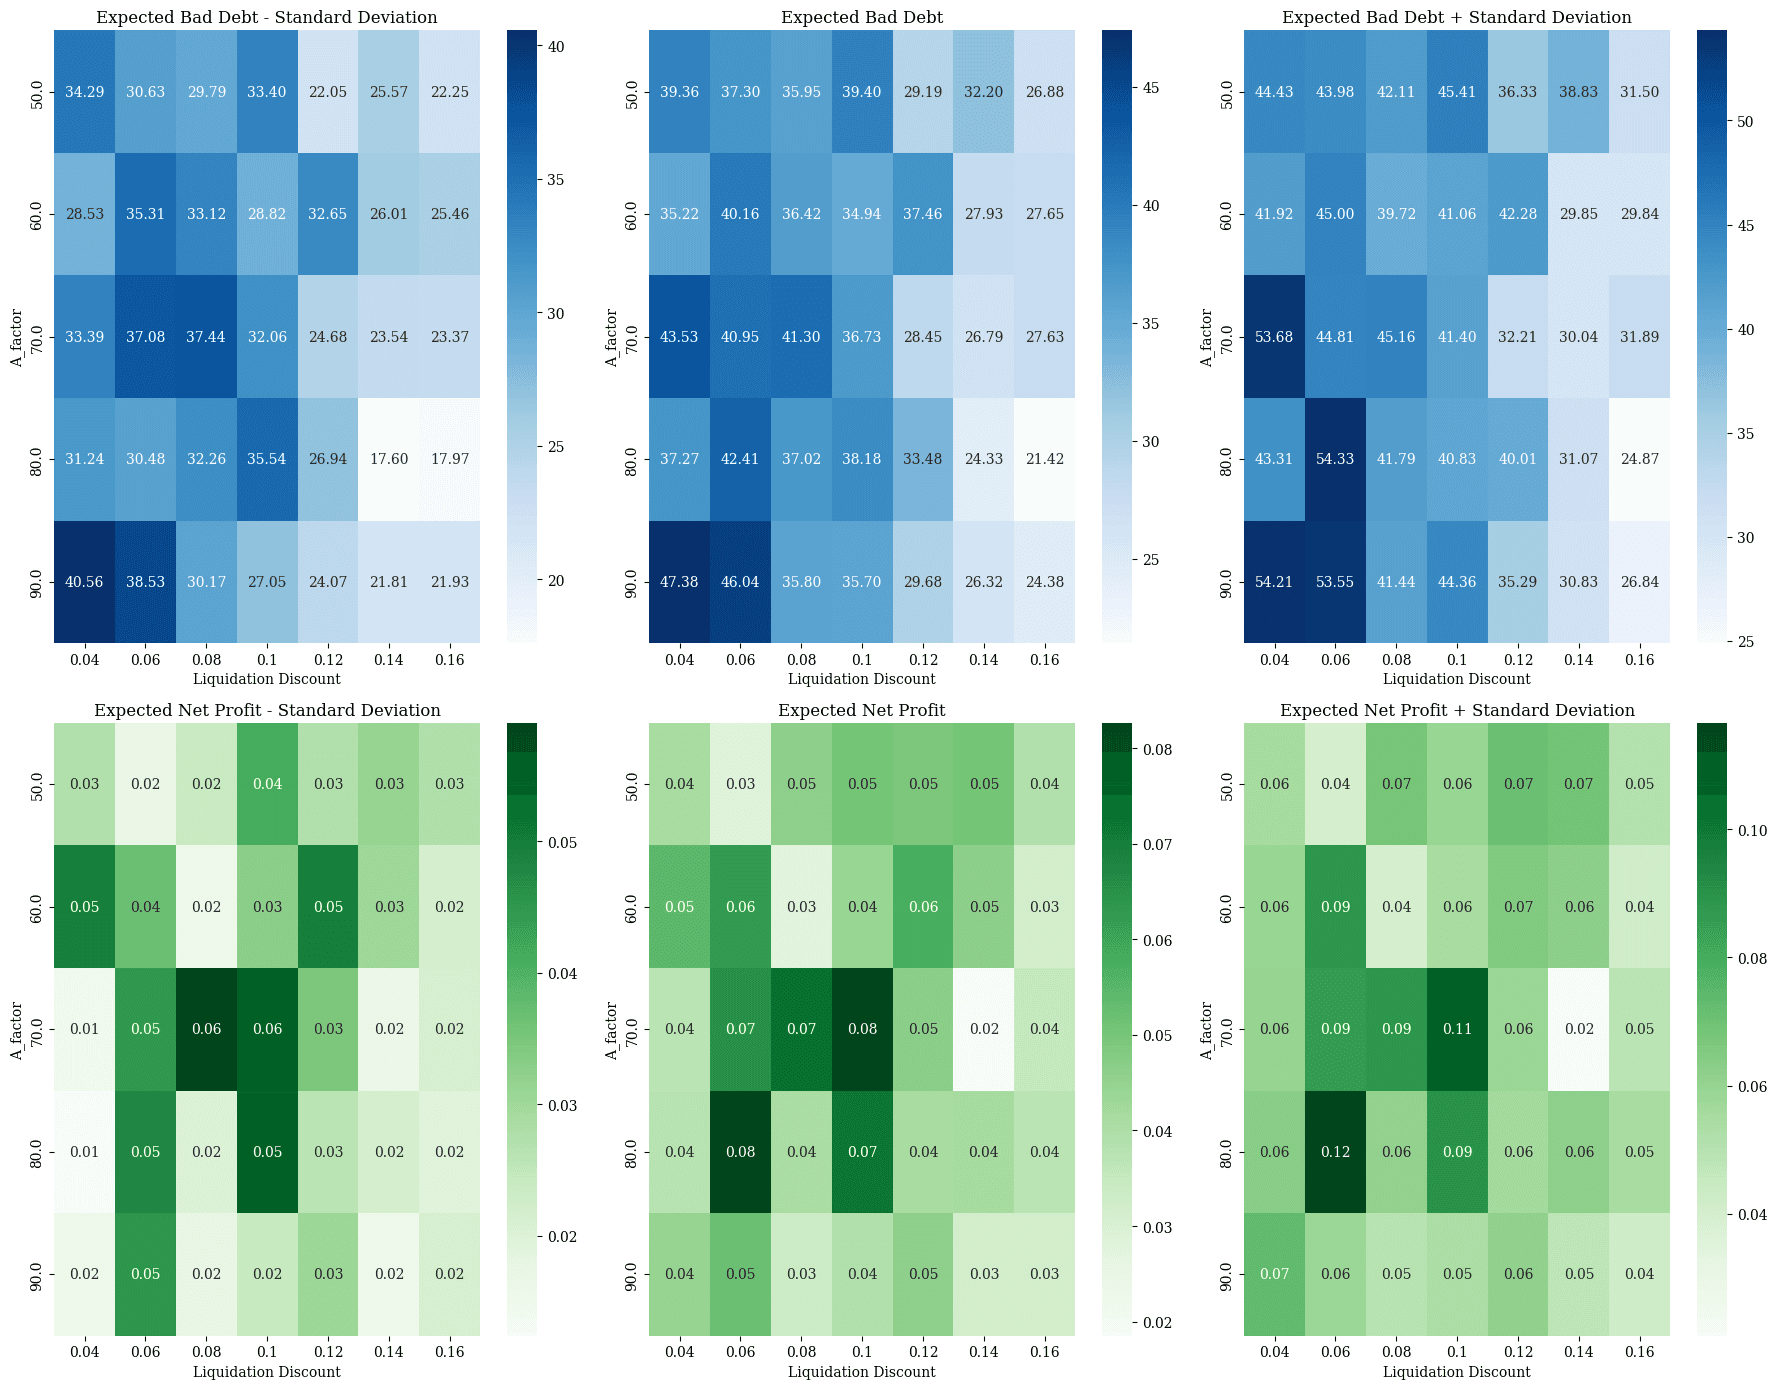
#Fee vs. Liquidation Discount (Fixed A): Net Borrow Loss
We now look at the median borrower loss to find a trade-off between the efficiency rebalancing liquidity in the bands vs the cost of rebalancing to the borrower.
#liquidation_discount 0.06 | A Factor 50 to 60
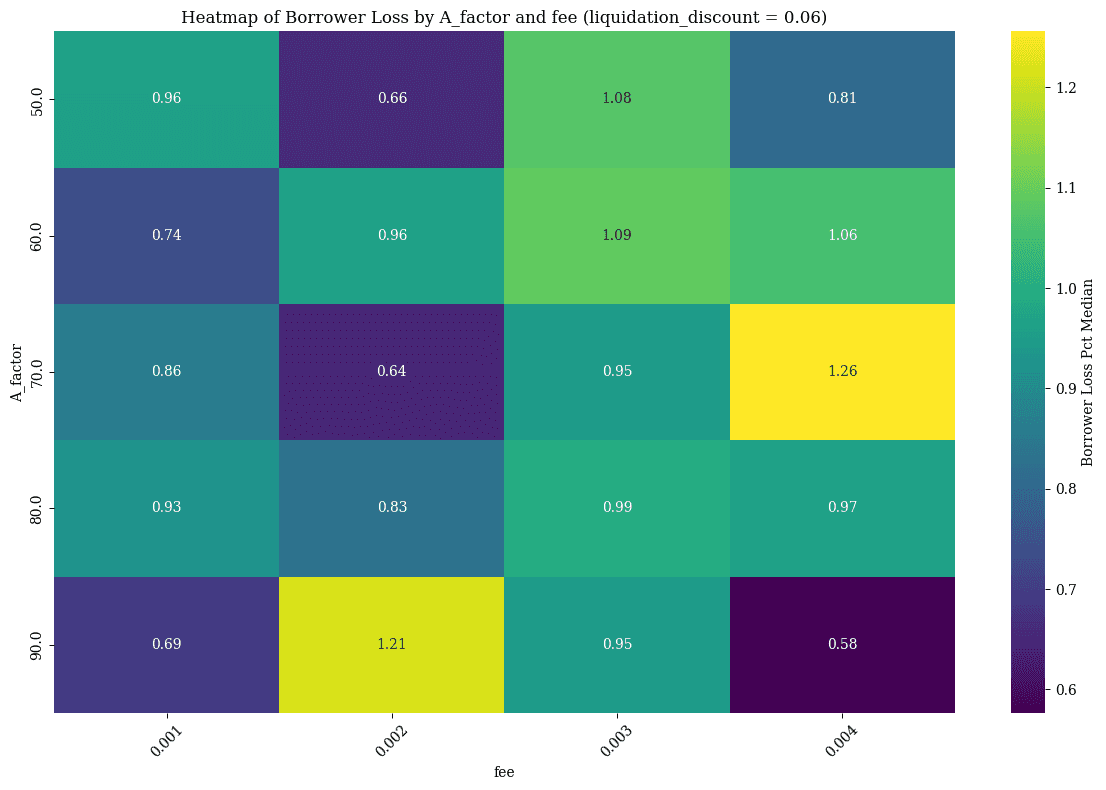
Fee seems unclear - potentially lower tier 0.001 to 0.002
#liquidation_discount 0.08 | A Factor 50 to 60 and 80 to 90
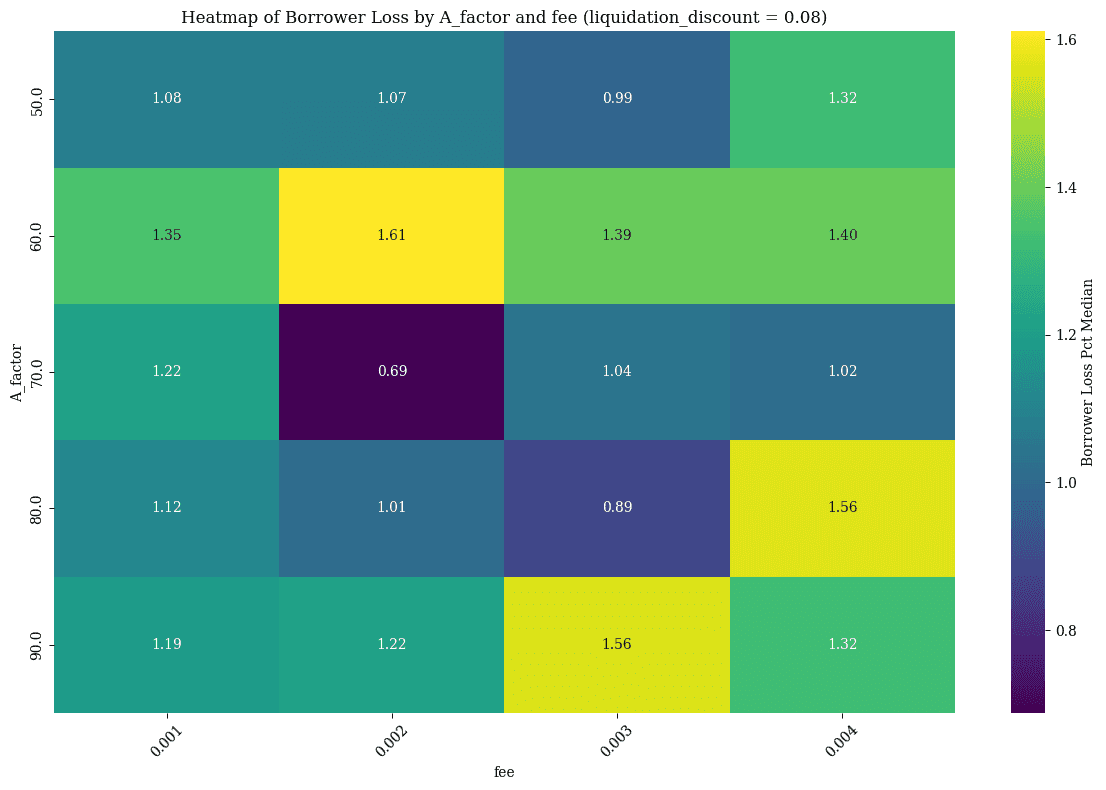
Viable ranges seem 0.001 to 0.003 (view all possible ranges in combination)
#liquidation_discount 0.1 | A Factor Range 60 to 70
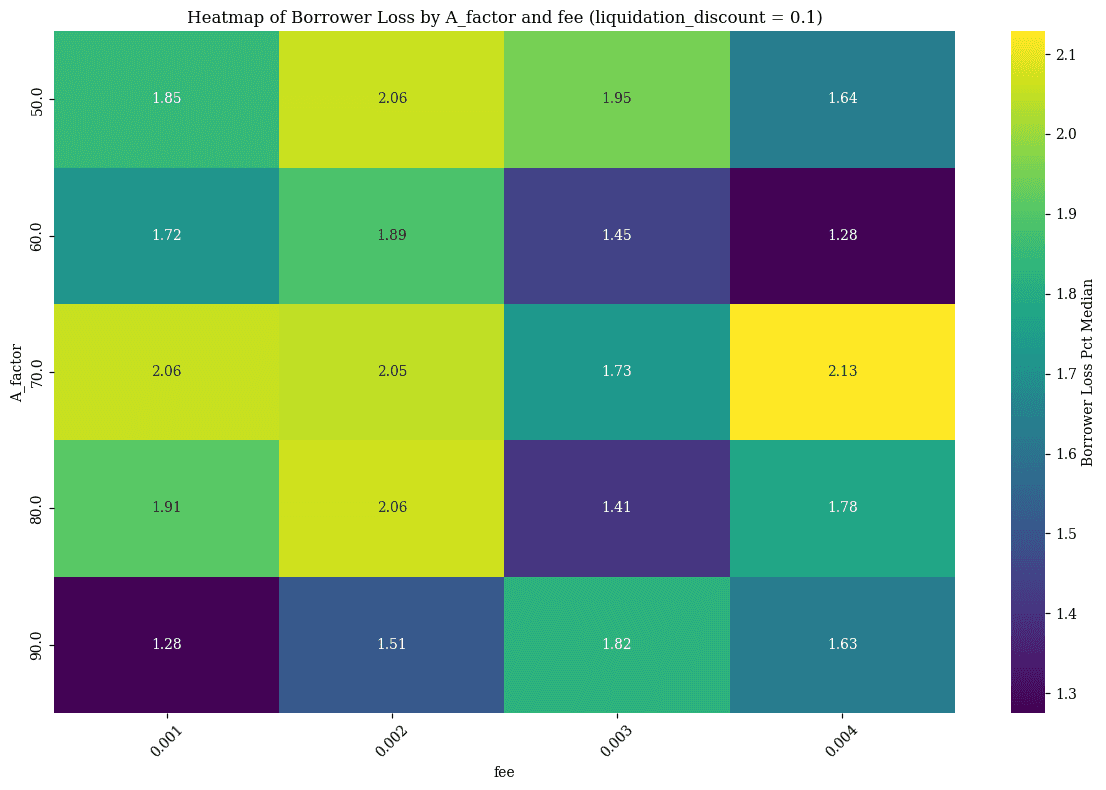
Fee 0.003
